Understand how the “market makers” in the cryptocurrency circle work in one article?
Many friends said that this wave of sharp decline was caused by problems with Binance’s market makers, including the $PAXG anchored to gold.
Why do many retail investors say that the price drops when they buy and rises when they sell?
So, what does a market maker do? How does it work?
1. Handling fee refund
2. Bidirectional orders, after both are executed, a small spread profit is accumulated. The essence is to use time and information delay to capture liquidity
3. Price discovery, helping the market to price efficiently and provide liquidity
4. Manipulating the market by selling liquidity to retail investors based on news
The original English word for “market maker” is 市場 Maker. In other words, where there is no market, market makers make (create) a market.
First, suppose you are a market maker for a project and you have an order book that looks like this:
Let’s make some assumptions: no other investors are posting limit orders in this market, you are the sole liquidity provider, and therefore the only market maker; the minimum price increment is 0.01; all takers pay a 0.025% handling fee, and all makers receive a 0.01% rebate.
You are a market maker, the one who places orders. You can get a 0.01% rebate for all orders in the market that are executed at your market price.
The spread between the best bid and best offer (bb/o) is called the spread. The current spread in the order book is 0.01.
Now, a market sell order comes in, matching your bid price of 100. You paid 100 for this transaction, but the other party actually only received 100-0.025*100=99.975. Of this, 0.025 (100*0.025%) is the handling fee, and you get a 0.01% rebate, so you actually only paid 99.99.
Because the buy one position was removed, the order book structure has changed, and the spread is now 0.02. However, the market price is still 100, because this was the last traded price:
If a buy order comes in at this moment, it will be executed at your sell price of 100.01. You bought at 99.99 in the previous order and sold it at 100.01 here, making a profit of 0.02. Adding the rebate, the total profit of this buy and sell is about 0.03.
Even though the spread between your buy one (100) and sell one (100.01) is only 0.01, the actual profit is as high as 0.03!
If there are continuous market orders coming in and you make transactions, you can earn 0.03 for each transaction. If you accumulate this amount, you will be rich in no time!
But unfortunately, the market did not develop as smoothly as you expected. After you took over the goods at 99.99, the spot market price immediately dropped from 100 to 99.80. You immediately withdrew the buy orders of 99.99 and 99.98 to avoid being arbitraged by others.
Because the current price has fallen to 99.80, your sell price is still 100.01, which is too high and no one will trade with you at this price. Of course, you can adjust the sell price to 99.81, but it will result in a loss of 0.17.
Don’t forget, you are the only market maker in the market. You can fully utilize this advantage to adjust the order book and minimize losses!
You calculate what price to place a sell order to break even. You take delivery of the stock at 99.99. To close the order at a break-even price, you place a sell order at 99.98 (because, with the rebate, the actual net profit is 99.99, breaking even).
So you adjust your order book, placing orders at 99.80 and 99.79 on the Buy 1 and Buy 2 positions respectively, and an order at 99.98 on the Sell 1 position:
Despite the current wide spread, as the sole market maker, you can choose not to lower your sell price. If someone is willing to fill your sell order at the top ask price of 99.98, everyone is happy. If not, that’s fine, because your buy order price has already been lowered to 99.80, and a market order will come in to fill yours.
At this point, a market buy order comes in and executes your buy order. You now hold two contracts, and the cost of holding the position is split evenly: (99.79 + 99.99) / 2 = 99.89. (The previous order was executed at 99.99, and this one is executed at 99.79. The lower price than the buy order is due to our 0.01% commission rebate.)
OK, now your average holding cost has dropped to 99.89. You lower your ask price from 99.98 to 99.89. Suddenly, the huge price difference has been cut in half. You can continue to do this, gradually reducing your costs and narrowing the price difference.
In the example above, the price only fluctuated by 0.2%. What if the price suddenly fluctuated by 5%, 10%, or even more? Even if you use the above method, you may still lose money because the price difference is too large!
Therefore, market makers need to study two issues:
How volatile is the price in different time windows?
What is the market’s trading volume?
Simply put, volatility is the degree to which a price deviates from its mean. Price volatility varies across different time windows. A commodity may fluctuate wildly on a one-minute candlestick chart, while remaining relatively stable on a daily chart. Trading volume provides an indication of liquidity, which influences the spread and execution frequency of pending orders.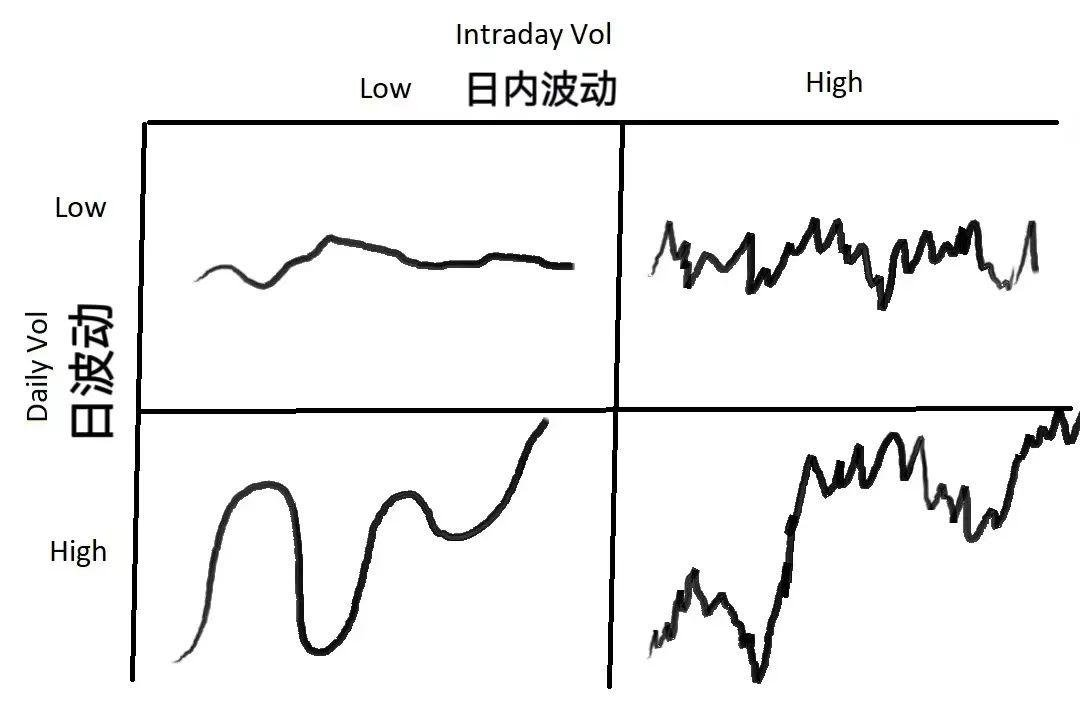
The above diagram illustrates four types of price fluctuations. Market makers need to choose different responses to different fluctuations:
If the overall market volatility is low, with both daily and intraday volatility being low, then a smaller spread should be chosen to maximize trading volume.
If daily volatility is low but intraday volatility is high (meaning the price fluctuates significantly but doesn’t change materially), you can increase the spread and use a larger order size. If the price moves in an unfavorable direction, you can use the above-mentioned method of averaging the cost to reduce losses.
If daily volatility is high but intraday volatility is low (in other words, prices are moving at a steady pace out of a trend), you should use a smaller, tighter spread.
If both daily and intraday volatility are high, you should widen your spread and use smaller order sizes. This is the most dangerous market situation, often scaring off other market makers. Of course, while this danger exists, it also presents many opportunities. Most of the time, market makers will earn stable profits, but when the market is erratic, it can penetrate one side of your order book, forcing you out of the market at a loss.
There are two key steps in market making: determining the fair price and determining the spread.
The first step is to determine the fair price, which is the price at which you should place your order. Pricing is a crucial first step. If your understanding of the fair price deviates significantly, you may not be able to sell your inventory, and you will ultimately have to close your position at a loss.
The first way to determine pricing is to reference the price of the same instrument in other markets. For example, if you’re trading USD/JPY in the London market, you could reference its price in the New York market. However, this method can become unreliable if prices in other markets fluctuate significantly.
The second pricing method is to use the mid-price, which is calculated as (buy price + sell price)/2. Using the mid-price is a seemingly simple but highly effective approach because the mid-price is the result of market forces. Quote around mid, and the market is likely right. Using the mid-price, the market is likely right.
In addition to the two pricing methods mentioned above, there are many other pricing methods, such as pricing based on algorithmic models and market depth, which will not be elaborated here.
The second issue market makers need to consider is the spread. To determine the appropriate spread, you need to consider a series of questions: What is the average market volume? How much does this volume vary (or variability)? What is the average size and variability (or variance) of take orders? What is the volume of pending orders near the fair price? Furthermore, you must consider price volatility and variance within a narrow time window, the fees you pay/earn as a market maker, and other secondary factors such as interface speed and order placement and cancellation speed.
In a very short period of time, the expected profit of a market maker is actually negative, because every taker order wants to be executed with you when its own price is advantageous, unless it is a forced stop-loss order. Every other participant in the market wants to profit from you.
Imagine that you are a market maker, where would you place the order?
To maximize the spread, assuming your pending order can be filled, you need to place your order at the very front of the order book, at the bid/ask price. Your bid/ask order will be quickly filled as soon as the price changes. However, frequent price fluctuations are a disadvantage. For example, if you’ve just received the goods and the price changes, your original ask/ask order will no longer be filled at the listed price.
In a market with insufficient liquidity and small price fluctuations, placing orders at the buy/sell position is safer, but this will lead to another problem – other market makers will find you and place orders before you with a smaller spread (tighten the spread). Everyone will rush to narrow the spread until there is no profit.
Now let’s explore the mathematical basis for determining the spread. Let’s start with volatility. We need to determine the volatility of the asset’s price/volume around its mean over very short time periods. The following mathematical calculations assume a normal distribution of price activity, which of course deviates from reality.
Assume we use a sampling period of 1 second, with the past 60 seconds as the sample. Assume the mean of the current median price is the same as the mean of the previous 60 seconds (remember, the mean remains constant here), and that this mean has a standard deviation of 0.04 from the current price. Since we previously assumed that price movement follows a normal distribution, we can further conclude that 68% of the time, the price will fluctuate within 1 standard deviation of the mean ($-0.04 to +$0.04); and 99.7% of the time, the price will fluctuate within 3 standard deviations of the mean ($-0.12 to +$0.12).
OK, let’s quote a spread of 0.04 on either side of the mid-price, or a spread of 0.08. 68% of the time, the price will fluctuate within one standard deviation of the mean ($-0.04 – +$0.04). Therefore, for the orders to be filled, the price must fluctuate through the range of either side, exceeding one standard deviation. 32% of the time (1 – 68% = 32%), the price will fluctuate outside this range. Therefore, we can roughly estimate the profit per unit time: 32% * $0.04 = $0.0128.
We can continue to deduce: If an order is placed with a spread of 0.06 (0.03 away from the mid-price), corresponding to 0.75 standard deviations (0.03/0.04=0.75), the probability of the price fluctuating by more than 0.75 standard deviations is 45%, and the estimated profit per unit time is 45% * 0.03 = $0.0135. If an order is placed with a spread of 0.04 (0.02 away from the mid-price), corresponding to 0.5 standard deviations (0.02/0.04=0.5), the probability of the price fluctuating by more than 0.5 standard deviations is 61%, and the estimated profit per unit time is 61% * 0.02 = $0.0122.
We found that placing an order with a spread of 0.06, or 0.75 standard deviations, yields the maximum profit of $0.0135! This example shows the cases of 1, 0.75, and 0.5 standard deviations, respectively. Comparing the two, 0.75 standard deviation yields the maximum profit. To further confirm this intuition, I used Excel to derive the expected returns for different standard deviations and discovered that the expected return is a convex function, reaching its maximum value precisely around 0.75 standard deviations!
The above assumes that price fluctuations follow a normal distribution with a mean of zero, meaning the market’s average return is zero. However, in reality, the mean of prices can vary. A shift in the mean makes it more difficult for orders on one side to be filled. When we hold inventory, we not only lose money but also reduce our expected profit margins.
In short, the market maker’s expectations are composed of two parts: one is the probability that the order can be executed. For example, if an order is placed with 1 standard deviation, it will be executed 32% of the time; the other is the probability that the order cannot be executed. For example, if an order is placed with 1 standard deviation, 68% of the time the price will move in the middle of the spread, resulting in the order not being executed.
When pending orders are unfilled, the average price is likely to change. Therefore, market makers must manage their “inventory cost.” This “inventory cost” can be thought of as a loan with interest. Over time, volatility increases, and so does the interest. Market makers can use the average volatility over various periods to develop a regression strategy and limit their holding costs.
Finally, brothers, why do many retail investors say that the price drops as soon as they buy and rises as soon as they sell? This is not without basis, and this article gives the answer!
この記事はインターネットから得たものです。 Understand how the “market makers” in the cryptocurrency circle work in one article?Recommended Articles
Related: BitMart Insights: August Crypto Market ReviewRecommended Articles
TL,DR 2025 年 8 月,美国经济处于通胀高于目标但边际放缓、就业动能显著减弱、消费信心走低的微妙转折点。市场普遍押注美联储将在 9 月开启降息通道,以应对“通胀缓和+就业转弱”的组合风险。然而,国际地缘摩擦与国内政策透明度的不确定性,仍对投资者信心与市场风险偏好构成重要掣肘。 8 月新上线的热门项目主要集中在基础设施和 DeFi 赛道,代表性的 PROVE、TOWNS、TREE 已登陆十余家主流交易所,流动性和市场认可度均较高。与此同时,Kanye West 推出的个人 MEME 代币 YZY 市值一度突破 30 亿美元,但随后快速回落,波动剧烈。 比特币(BTC)徘徊在 110,530 美元关键支撑下方,空头压力仍重,若失守或下探至 105,000–100,000 美元;反之若突破 117,500 美元,则可能进入宽幅区间整固。以太坊(ETH)在创下 4,956 美元新高后回落至 4,424 美元,关键支撑位在 4,349 美元,若反弹则有望上攻 5,000–5,500 美元,同时机构资金持续流入凸显资金偏好转向 ETH。Solana(SOL)在 188 美元附近整固,价格形态呈上升三角形,突破 210 美元或开启新一轮上涨至 240–265 美元,但若跌破趋势线则可能回调至 155 美元。 8 月,以太坊在财库与 ETF 双重驱动下突破历史新高,价格一度触及 4,945 美元,市值接近 6,000 亿美元,财库逐步向“囤币 + 收益化”模式转型,进一步强化了其核心资产地位。同月,WLFI 开启盘前合约交易,FDV 一度达 260 亿美元,并通过严格的解锁机制与稳定币 USD 1 的多生态整合,快速吸引市场关注,但同时也放大了投机性与波动。此外,Pendle 在 Arbitrum 上推出资金费率衍生品平台 Boros,率先将资金费率标准化并代币化,首日交易量突破 3,600 万美元,推动 Pendle TVL 创新高,展现出巨大的市场潜力。 Solana 生态正迎来储备型机构加码,Galaxy Digital、Multicoin、Jump Crypto 和 Pantera 等计划筹集数十亿美元布局 SOL,增强市场流动性和生态扩张潜力。与此同时,Uniswap 提交 DUNI 提案,将 DAO 注册为怀俄明州 DUNA 并成立新实体,为治理提供法律身份与链下运营能力,推动 DeFi 合规化进程并提升 UNI 的价值捕获能力。 1、宏观视角 2025 年 8 月,美国宏观经济依然处于“通胀仍高于目标、增长动能持续减弱”的局面。整体通胀尚未出现大幅回落,但市场对未来缓和的预期逐步增强。与此同时,就业市场边际疲软、消费信心走低,使得市场押注美联储将在秋季进入降息通道。国际地缘风险与国内政策不确定性,则继续对投资者信心和市场风险偏好构成制约。 通胀仍高于目标 从通胀角度看,7 月 CPI 环比增长 0.2%,同比上涨 2.7%,与 6 月持平;核心 CPI 同比升至 3.1%,高于上月的 2.9%。住房、医疗和交通等服务板块价格上涨压力显著,而能源价格小幅下降对冲部分涨幅。整体来看,通胀仍处于美联储 2%目标之上,但市场普遍预计 8 月可能出现边际回落,为货币政策松动提供条件。多位联储官员强调仍需看到更多数据,以确认通胀下降的持续性。 劳动力市场趋弱 7 月非农就业仅新增 7.3 万人,显著低于预期,失业率上升至 4.2%。8 月以来,初请失业金人数增至 23.5 万人,为 6 月以来最高,持续申领人数也攀升至 197 万人。这些数据显示劳动力市场正在逐步转弱,就业信心下滑。 消费回弹乏力 消费方面,高利率与信用成本上行继续压制居民消费意愿。8 月消费者信心指数进一步下降,密歇根大学指数降至 58.6,Conference Board 指数降至…