ETF Funds Begin to Return, What’s Missing for a True BTC Recovery?
Original Compilation: AididiaoJP, Foresight News
Bitcoin has stabilized around $70,000 with improved fund flows and eased selling pressure. However, spot trading volume remains low, and supply pressure exists above the market, indicating that stronger demand is still needed to drive a lasting recovery.
सारांश
- Bitcoin gradually stabilized after a sharp sell-off to around $67,000 and rebounded near $70,000, but the upward momentum remains hesitant.
- Unrealized losses have increased but remain within historical norms, indicating market stress but not yet a full capitulation phase.
- A significant amount of Short-Term Holder supply is concentrated between approximately $93,000 and $97,000, forming a key overhead resistance zone.
- Realized losses remain high but show no signs of panic, suggesting an orderly risk reduction phase rather than panic selling.
- Spot trading volume remains depressed, with no significant volume increase during the price recovery, reflecting weak market confidence and only selective bottom-fishing.
- US spot ETF flows have turned to slight net inflows after a period of sustained net outflows, indicating potential renewed institutional interest.
- Perpetual swap funding rates remain negative, reflecting persistent bearish sentiment and cautious derivative positioning.
- Futures open interest remains relatively low, indicating limited leverage expansion supporting the current rebound.
- In the options market, skew indicators have stabilized, and implied volatility is range-bound, suggesting reduced demand for hedging downside risk.
- बाज़ार maker Gamma exposure has turned slightly positive, indicating improved liquidity conditions and a more balanced market structure.
On-Chain Insights
Higher Lows, Heavy Overhead
Despite ongoing geopolitical tensions creating uncertainty in equity, energy, and commodity markets, Bitcoin has consistently formed higher highs and higher lows since early March, establishing a constructive structure within the $60,000 to $70,000 range.
If this resilience persists, the market could lay a relatively solid foundation for long-term upward movement. The Short-Term Holder cost basis distribution heatmap shows the price concentration zones of recently acquired supply, helping to identify potential supply and demand zones from the perspective of new entrants.
Within the current price range, new accumulation zones are gradually forming. While not massive, they are sufficient to explain part of the recent upward momentum. However, from a medium-term perspective, the more prominent risk lies in the substantial supply from Short-Term Holders above $84,000. This group could amplify selling pressure whether the price recovers to that zone or faces renewed market stress.

Medium-Term Range
Building on the aforementioned supply dynamics, the Realized Price breakdown by holding period provides a more granular view, showing the distribution of cost bases across different investor cohorts. This metric tracks the average purchase price of tokens held for different durations, helping to define recent support and resistance levels from an investor behavior perspective.
Currently, the cohort holding tokens for 1 week to 1 month has a cost basis around $70,200, forming an emerging support level. The cohort holding tokens for 1 to 3 months has a cost basis around $82,200, further reinforcing the overhead resistance mentioned earlier.
Together, these two price levels define the most likely medium-term trading range. However, given the still limited scale of current accumulation, the robustness of the $70,200 support level remains to be tested. Until a more solid buyer base forms, the risk of a break below this level persists.

Heightened Fear, Not Capitulation
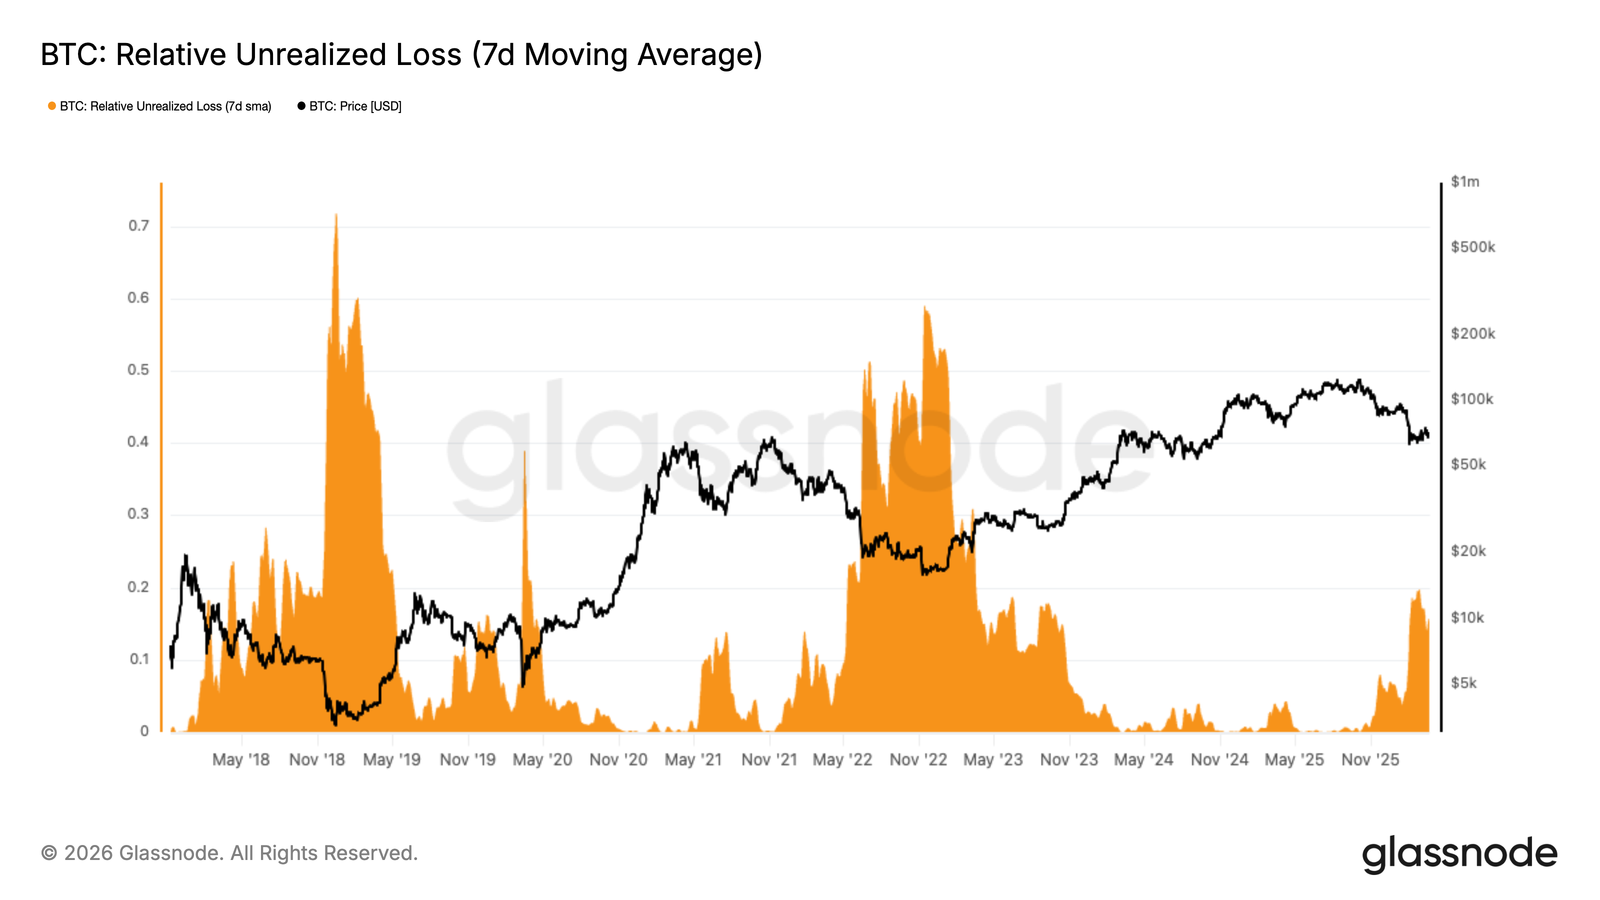
Expanding from these granular cost basis metrics, profit and loss indicators provide a broader cyclical perspective by examining the balance of greed and fear in the market. The Relative Unrealized Loss metric measures the total value of unrealized losses held by all investors as a percentage of market capitalization, serving as a key gauge of potential selling pressure and market sentiment.
Over the past two months, this metric has remained consistently above 15% of market cap, with a structure somewhat similar to the period in Q2 2022. This indicates a state of high fear in market sentiment but is far from the full capitulation levels seen during extreme stress events like the FTX collapse. Historically, resolving unrealized losses of this magnitude typically requires time, further price adjustment, or both. While a rapid V-shaped recovery is theoretically possible, given the current scale of unrealized losses, it would require sustained and robust new capital inflows in the short term.
Profit Flow Dries Up
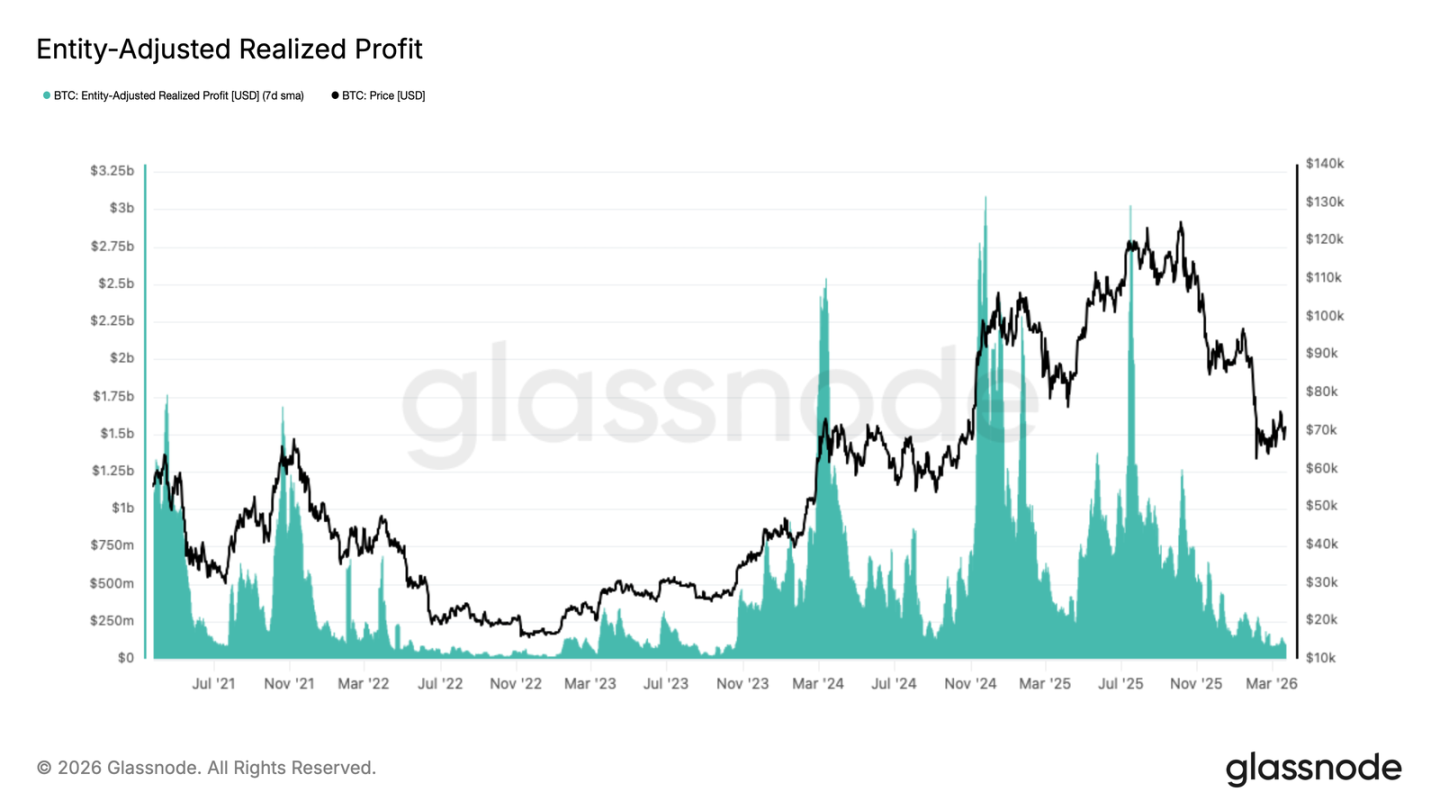
Against the backdrop of rising unrealized fear, realized profit levels have continued to contract significantly since Q4 2025, further confirming weak demand.
The Entity-Adjusted Realized Profit (smoothed with a 7-day simple moving average) filters out internal exchange transfers, providing a more accurate reflection of genuine profit-taking activity on the network. This metric has declined from a daily peak of around $3 billion in July 2025 to less than $100 million currently, a drop of over 96%. Such a sharp contraction is typical of the later stages of a bear market, where profitable sellers still in the market have largely been exhausted, and on-chain liquidity reaches cyclical lows. While this environment reduces short-term selling pressure, it also reflects a lack of fresh capital inflows needed to support a sustained market recovery.
Off-Chain Insights
Spot Volume Remains Depressed
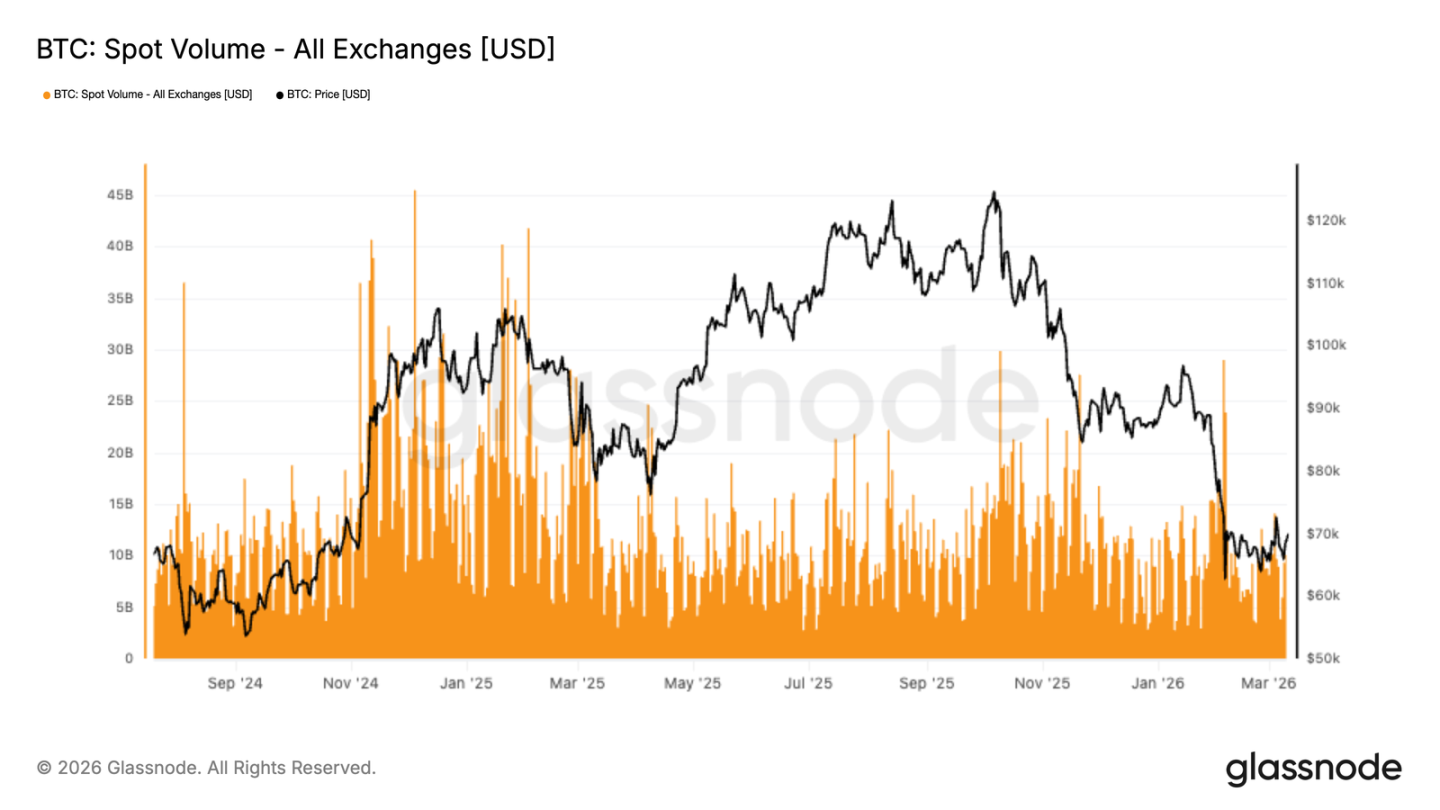
Following the sharp price decline to the $67,000 zone, overall spot market activity has remained subdued. During the subsequent recovery, trading volume on major exchanges showed only a muted response. While there were brief spikes in volume, they appeared more reactive than a signal of sustained, confidence-driven buying returning.
Compared to the more active participation during the earlier rally phase, current spot volume remains weak. This suggests the recent price recovery to around $70,000 relies more on selective dip-buying and short-term position adjustments rather than broad-based spot demand.
The divergence between stabilizing price action and low spot participation indicates the market is still in a rebalancing process. Until spot trading activity shows more sustained expansion, the continuation of any uptrend may be fragile, with price action potentially more sensitive to changes in derivative flows and liquidity conditions than to organic accumulation.
अदला-बदली Flows Rebound
After an extended period of net outflows, US spot ETF flows have shown initial signs of improvement recently, with the 7-day moving average turning slightly positive in recent sessions. This suggests institutional demand may be slowly returning as Bitcoin stabilized and recovered somewhat after falling to the $67,000 zone.
Although the absolute scale of inflows remains modest compared to previous accumulation phases, the shift in direction is noteworthy. The prior outflow phase coincided with weak price action and subdued sentiment, while the recent flow recovery indicates traditional market participants are tentatively re-engaging.
This shift is significant because ETF demand has been a key pillar of spot market support in this cycle. If flows can sustain net positive status, it would help confirm that institutional investor confidence is repairing and they are beginning to rebuild exposure.
Overall, the current recovery is in its early and mild stages. However, compared to the sustained outflows of recent weeks, the turnaround in flows marks a degree of positive change in market structure.

Negative Funding Rates Persist
Despite Bitcoin’s gradual stabilization and attempts to recover from the recent pullback, perpetual swap funding rates remain in negative territory. This indicates short positions still dominate, with traders willing to pay funding costs to maintain downside exposure.
The persistence of negative funding rates reflects a generally cautious mindset among derivative market participants. Even as the price structure improves, traders are not yet showing a willingness to aggressively rebuild long positions. This contrasts with past recovery phases where funding rates typically normalized or turned positive as sentiment improved.
From a positioning perspective, persistently negative funding rates could, to some extent, become a potential driver for upward price movement, as they reflect relatively crowded short positions. If upward momentum continues, the market could face a short squeeze. On the other hand, it also indicates limited confidence in the current recovery, particularly among leveraged traders.
The current setup shows derivative market positioning remains defensive. Despite some stabilization in spot and ETF flows, overall risk appetite still leans bearish.

ATM Implied Volatility: Range-Bound, Awaiting Direction
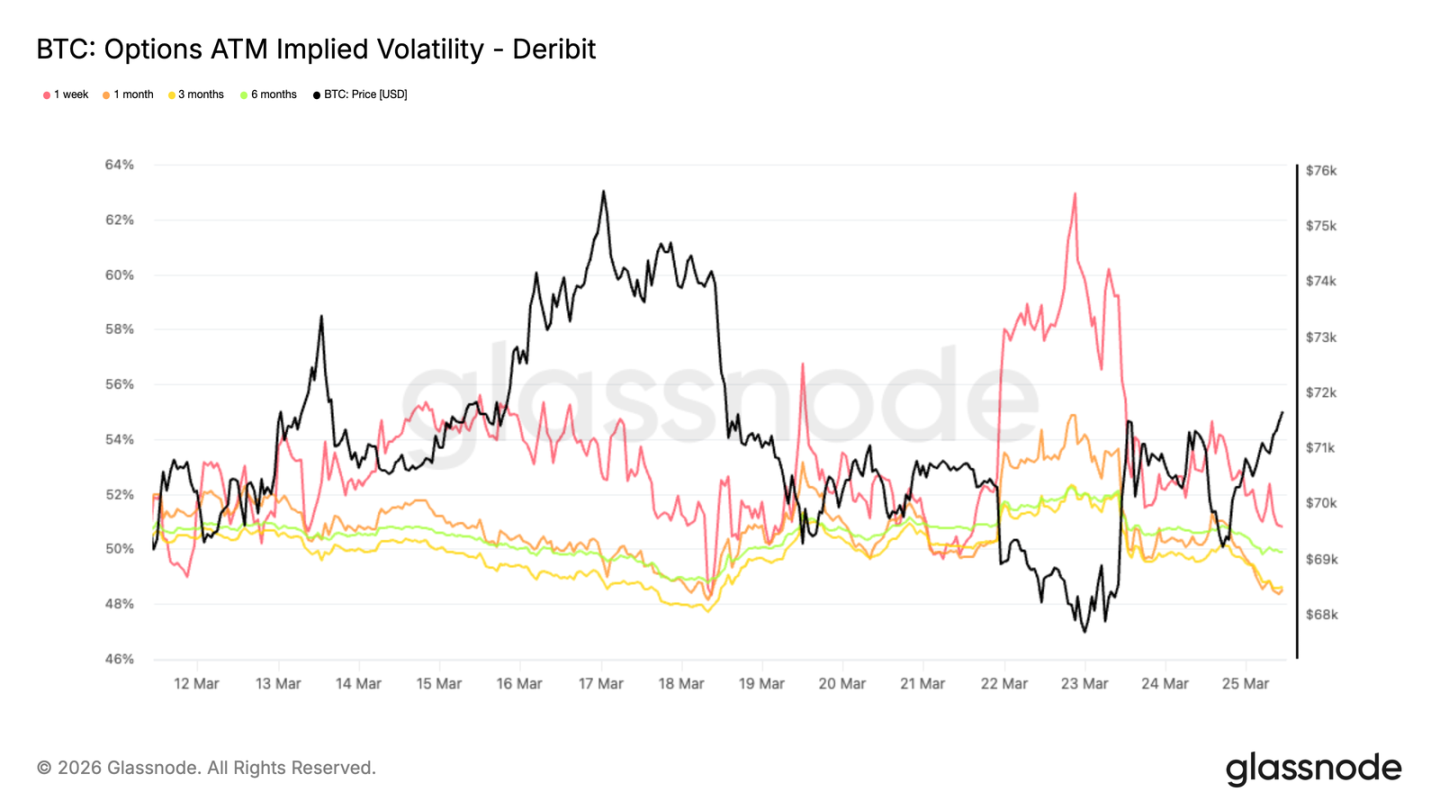
In the options market, Bitcoin’s At-The-Money (ATM) implied volatility exhibits characteristics similar to the spot market, remaining range-bound with a mean-reverting tendency. The front end of the volatility curve is most sensitive to macro events and short-term news flow. The 1-week tenor shows relatively larger swings but remains confined to a narrow range between 50% and 60%. Implied volatility for longer-dated tenors continues to hold below 50%, with limited differentiation across expiries.
The overall low level of implied volatility reflects a market waiting for new catalysts to reprice two-way risk. Suppressed long-dated implied volatility indicates no structural shift in the market’s pricing of long-term risk at this stage, with short-term volatility primarily driven by trading activity in near-month contracts. In this environment, volatility instruments are used more to navigate short-term uncertainty than to express long-term directional views.
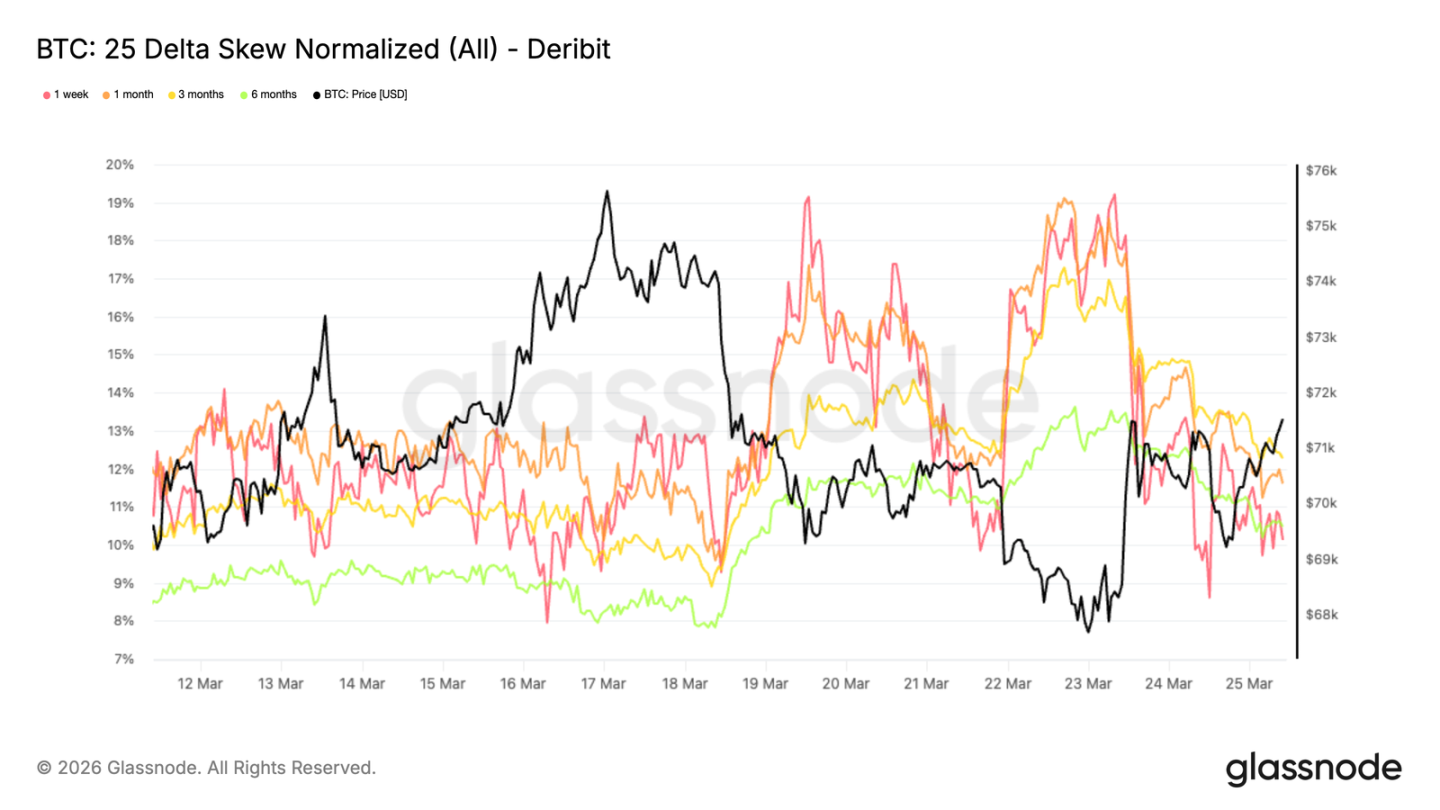
25 Delta Skew: Downside Protection Still Dominant
During the brief volatility uptick this week, skew metrics widened towards put options, confirming that this volatility repricing was primarily driven by demand for downside protection.
The 25 delta skew (a metric measuring the relative cost of put options versus call options at the same delta value) climbed into the 18% to 19% range for 1-week and 1-month tenors earlier this week when Bitcoin’s price broke below $68,000. This clearly shows that demand for short-term downside protection spiked quickly as prices showed weakness against a backdrop of heightened geopolitical uncertainty.
The skew has since retraced but remains at relatively elevated levels, with readings across tenors converging around 10% to 12%. The convergence of skew values across the curve indicates that the preference for downside protection is not limited to near-month contracts but reflects a broad and persistent risk-averse hedging bias among market participants.
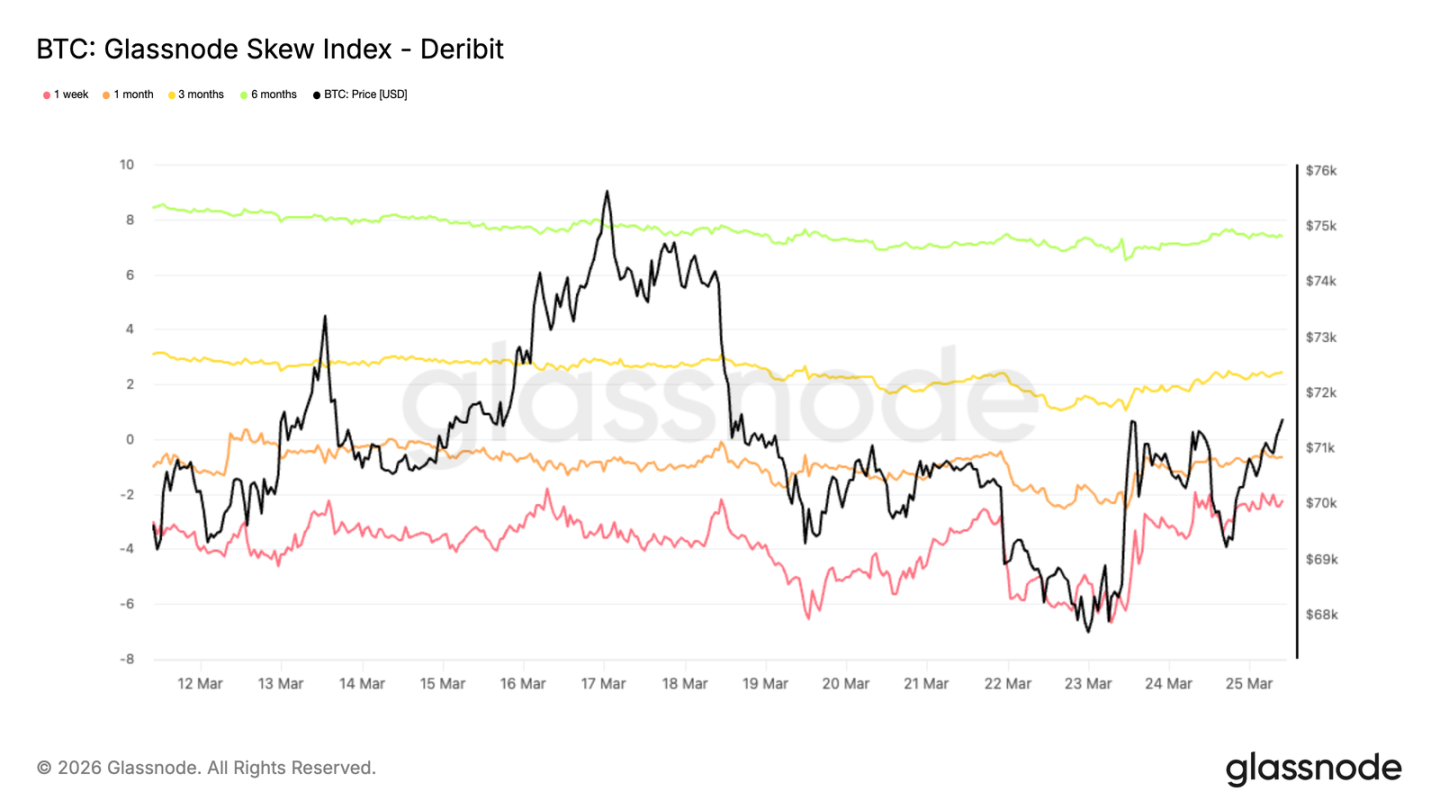
Skew Index Shows Divergent Tone
The Skew Index provides another perspective on options market conditions. Unlike the 25 delta skew, this index assigns higher weight to low-delta options in its calculation, offering a more comprehensive view of pricing in the distribution tails. Currently, readings for the 1-week and 1-month tenors remain in bearish territory, while readings for the 3-month and 6-month tenors (around 2.4% and 7.4%, respectively) have turned bullish (the index is calculated as call skew minus put skew).
This creates a notable divergence. The 25 delta skew shows a bearish bias across tenors, while the longer-dated portion of the Skew Index shows that, at the far end of the curve, upside tail risk is priced higher than downside tail risk. This implies that while there is still buying support for medium-to-low delta puts, the market is not accumulating deep out-of-the-money downside protection on a large scale for longer horizons. Overall, options market pricing reflects short-term caution but a long-term structure that is balanced or even slightly positive. This is a common feature in क्रिप्टो asset markets, where participants tend to use deep out-of-the-money call options to capture asymmetric upside potential.
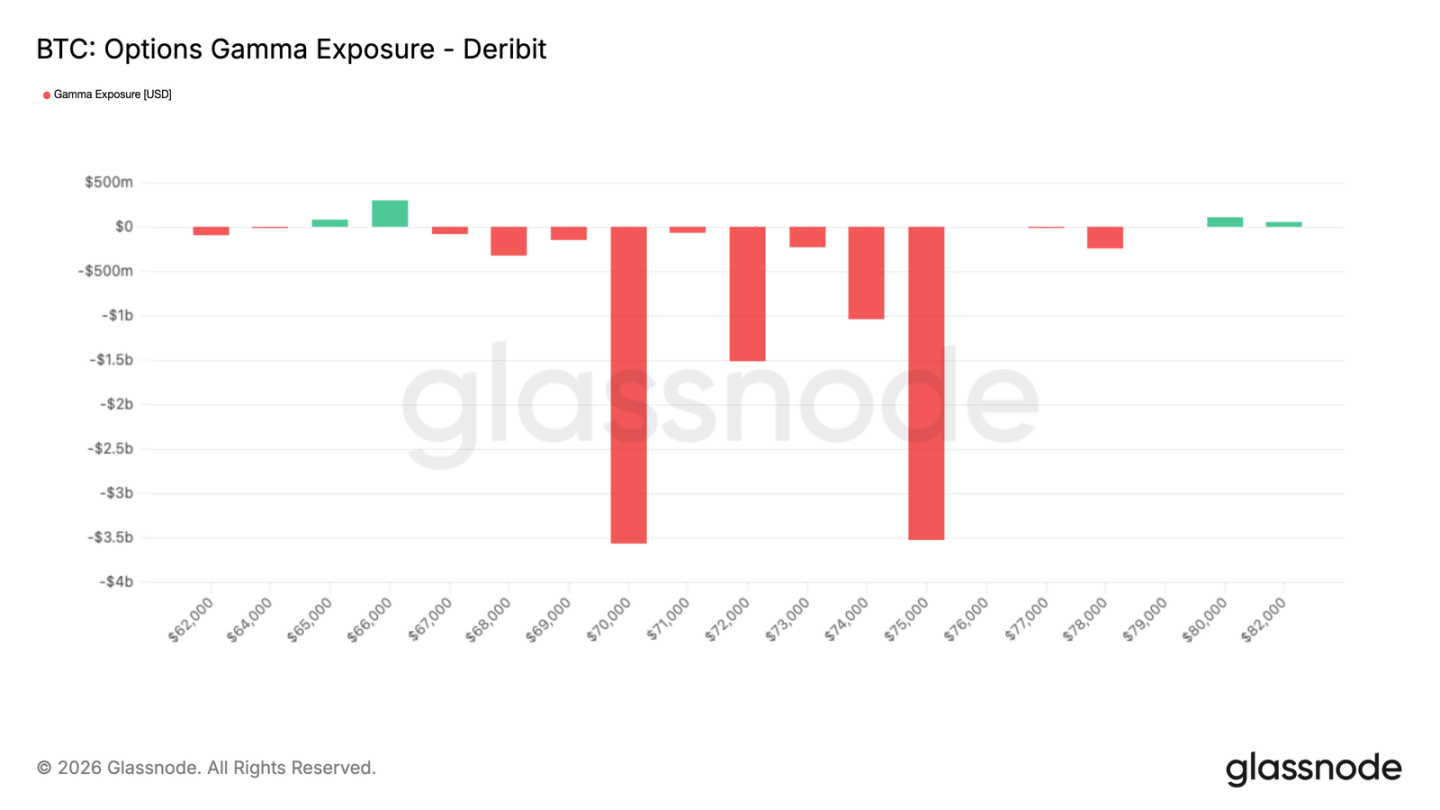
Market Maker Gamma: Expiry to Reset Market Structure
Friday, March 27th, marks a joint expiry for weekly, monthly, and quarterly options contracts. Such concentrated expiries often have a significant impact on Bitcoin’s price action. As the options market grows, the hedging activities of market makers increasingly influence prices in the short term. With less than 48 hours to expiry, market makers are overall in a short Gamma position, with risk exposure concentrated in the $70,000 to $75,000 range. Within this zone, especially in a relatively thin liquidity environment, prices could experience accelerated moves in either direction.
Notably, the size of the expiring positions is substantial. Approximately $10 billion in market maker short Gamma exposure is set to roll off, meaning a significant mechanical price driver will be removed. Once these positions are settled, market prices will be less constrained by hedging flows and are expected to respond more sensitively to external factors. In this context, changes in the macro environment could become a key factor influencing where Bitcoin finds its next equilibrium.
निष्कर्ष
Following a relatively sharp correction, the Bitcoin market is beginning to show some positive signals: prices are gradually stabilizing, ETF flows are improving, and positioning in the derivatives market is no longer one-sided. The pressure accumulated during the recent sell-off appears to be easing, with market conditions looking more balanced than a week ago.
However, the current environment is not yet sufficient to support a high-conviction breakout. Spot volume remains low, open interest has not expanded significantly, and concentrated supply pressure still exists overhead. Overall, market structure is repairing, but stronger market participation is needed to confirm a more sustainable uptrend.
At this stage, market structure shows constructive features but has not yet shifted into a clear bullish regime. If demand continues to return, opportunities will gradually emerge. However, confirming that this recovery has substantive momentum ultimately requires a significant expansion in spot trading volume and sustained inflows of new capital.
यह लेख इंटरनेट से लिया गया है: ETF Funds Begin to Return, What’s Missing for a True BTC Recovery?
Related: Profiting from the US-Iran War Isn’t Limited to Prediction Markets
Since late February 2025, tensions in the Middle East have escalated dramatically. The United States and Israel launched large-scale airstrikes against Iran, sending shockwaves through global financial markets. During a weekend of relentless conflict, while traditional financial markets were closed and Wall Street traders could only wait anxiously for Monday’s opening, another wave of investors was trading frantically on-chain platforms. They weren’t trading cryptocurrencies; they were trading gold, crude oil, and silver. Prediction markets like Polymarket and Kalshi saw their trading volumes surge due to war-related contracts, becoming the focal point of the market. But on the other side of the lens, perpetual DEXs (perp DEXs), including Hyperliquid, also “profited handsomely from the war”: trading volumes for commodity contracts on these platforms skyrocketed, with on-chain derivatives for traditional assets like…