TL,DR
- The overall macro environment in March was bearish: The Federal Reserve kept interest rates unchanged and sent hawkish signals; persistent inflation, rising oil prices, and weakening employment reinforced “stagflation” concerns, significantly pushing back rate cut expectations. Meanwhile, U.S. stocks weakened amid tariff uncertainties and geopolitical risks, putting overall pressure on risk assets. Looking ahead to April, the market will continue to grapple with inflation, non-farm payroll data, and policy path expectations. While the 加密 market is boosted by clearer regulatory signals, it still faces macro and political pressures.
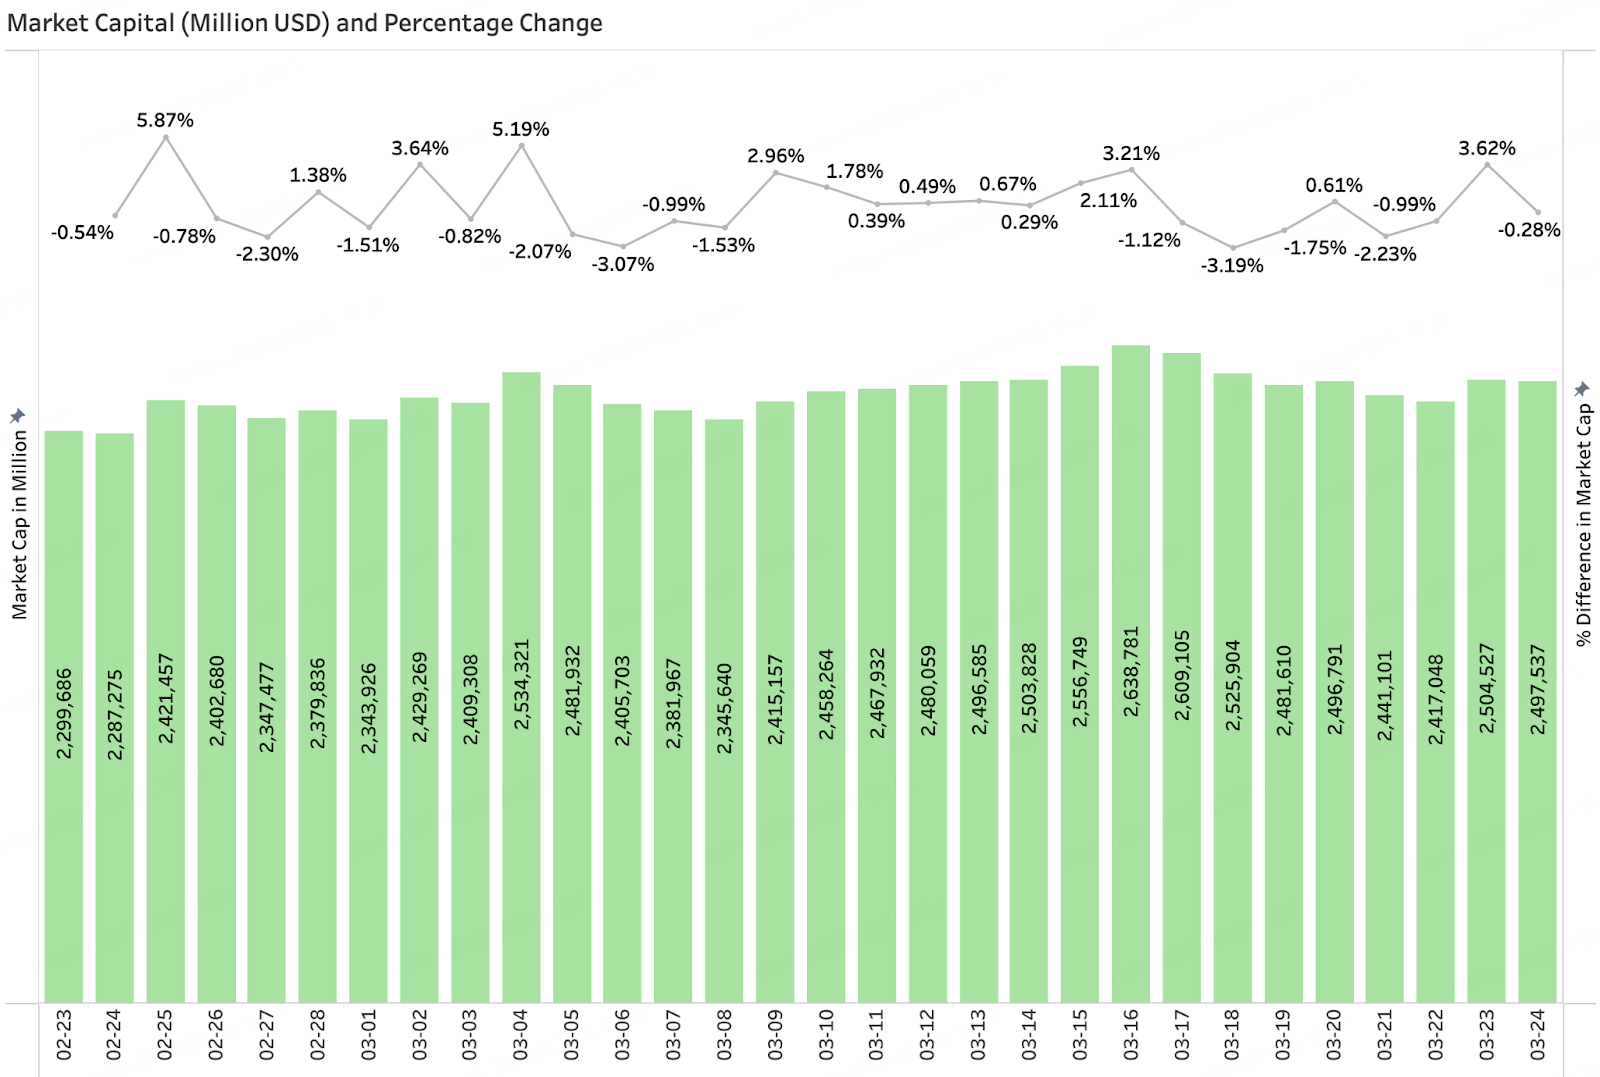
- March trading volume showed a pattern of “spike-and-quick-retreat,” with multiple instances of extreme price swings lacking sustainability, indicating short-term speculative capital as the main driver. The total market capitalization experienced mild fluctuations, peaking in mid-month before retreating to the $2.45–$2.50 trillion range, showing overall weak momentum.
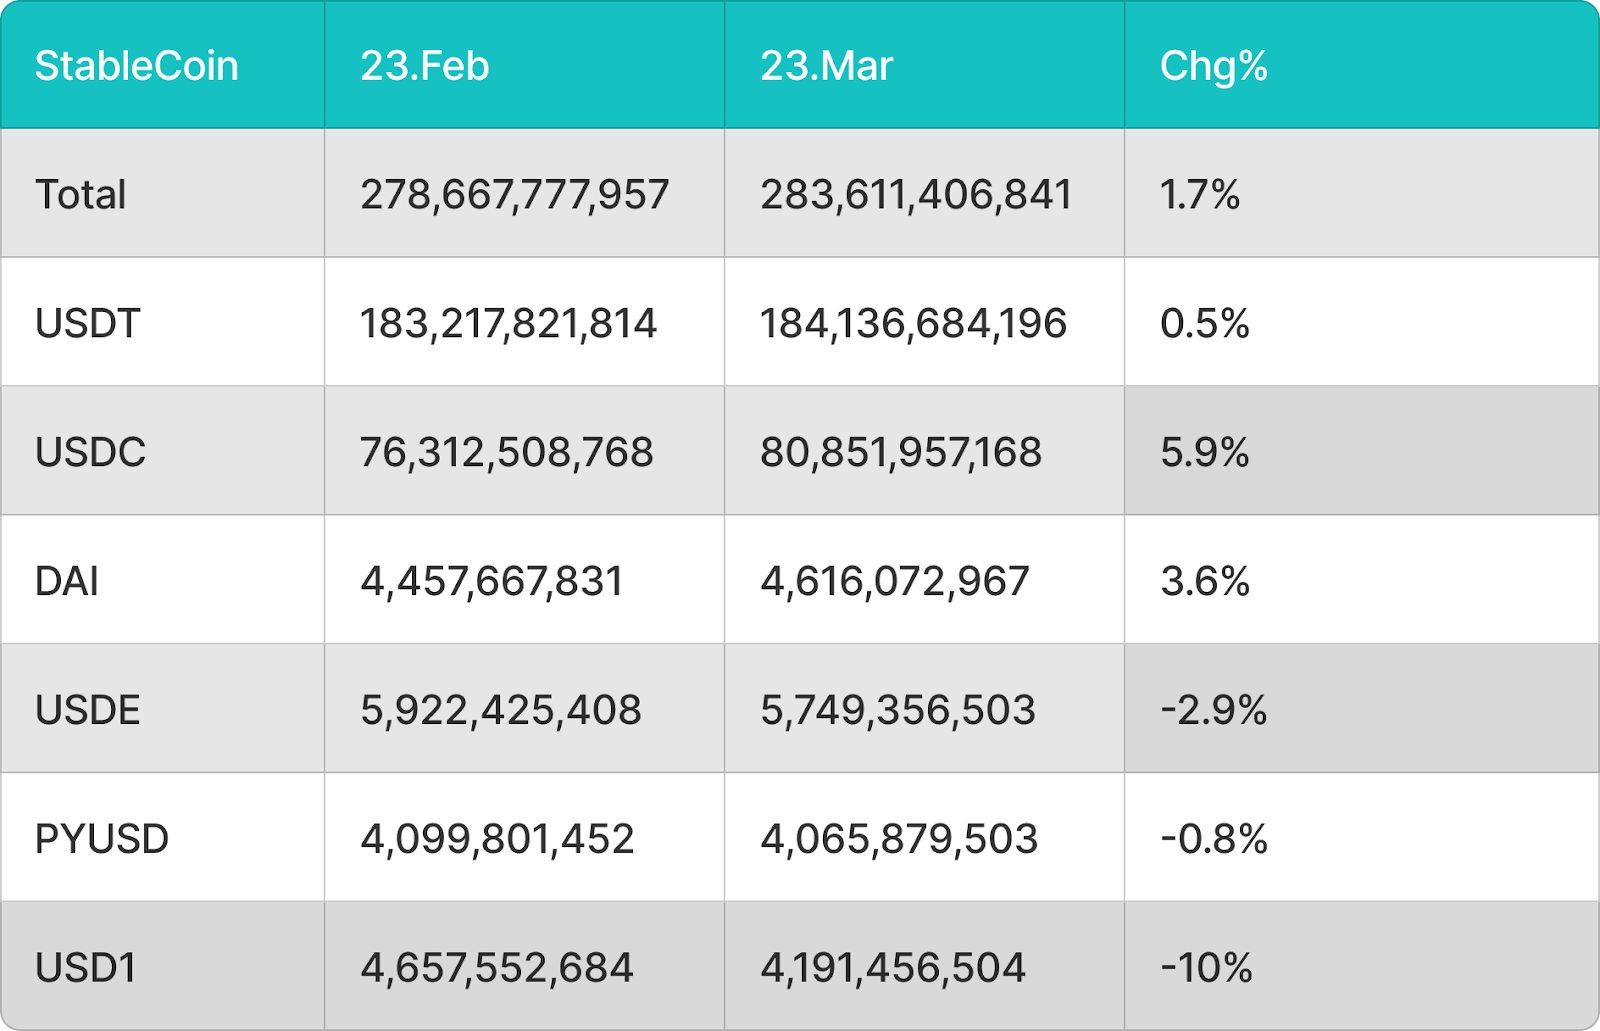
- In March, both BTC and ETH spot ETFs shifted from net outflows to net inflows, with asset size and prices recovering in tandem. ETH saw stronger capital return and price elasticity, reflecting capital flowing back into higher-volatility assets as risk appetite marginally improved. Meanwhile, the total stablecoin supply shifted from contraction to mild expansion, but concentration towards top-tier stablecoins intensified, indicating that while new liquidity is returning to the market, the overall phase is one of cautious recovery rather than full-scale risk expansion.
- In March, BTC traded within a $62,000–$74,000 range, currently around $69,000–$71,000, generally oscillating between the $65,000–$67,000 support and $72,000–$75,000 resistance. A directional breakout still requires macro environment support. ETH performed relatively weaker, mainly trading between $1,900–$2,200. Short-term pressure came from slowing ETF inflows and the hawkish FOMC stance; a sustained move above $2,200 is needed for a bullish signal. SOL showed relative resilience, trading between $82–$97, currently around $88–$92, maintaining a range-bound structure. Short-term focus is on the $82 support and the $95–$97 resistance breakout.
- The SEC and CFTC jointly established a digital asset classification framework, explicitly categorizing 16 mainstream assets including BTC and ETH as “digital commodities” and proposing a “代币 Safe Harbor” concept. This marks a significant reduction in regulatory uncertainty, providing a crucial legal foundation for institutional entry. Concurrently, BlackRock launched an Ethereum ETF (ETHB) that distributes staking rewards, advancing crypto ETFs from pure price instruments to yield-generating assets. However, security incidents like the Resolv hack highlight that industry risks are shifting from on-chain vulnerabilities to off-chain infrastructure and private key management, further elevating the importance of security frameworks.
- April will be a critical window for crypto regulation and legislation. If the CLARITY Act makes a breakthrough at the committee stage and advances to a vote, it will, together with the SEC/CFTC classification framework, form a complete regulatory loop, significantly enhancing policy certainty for institutional entry. Conversely, if progress stalls, market sentiment could face periodic pressure. Meanwhile, the Ethereum Giamsterdam upgrade enters a key testing phase, coupled with expectations for staking ETF ecosystem expansion, which will support ETH’s medium-term fundamentals and strengthen the long-term logic for institutional participation in the Ethereum network.
1. Macro Perspective
Policy Direction
On March 18, the Federal Reserve’s FOMC held its second policy meeting of the year, keeping the federal funds target rate unchanged at 3.50%–3.75% as expected. The market’s primary focus was on the dot plot and Chair Powell’s hawkish rhetoric during the press conference—the dot plot’s median projection for 2026 still indicated one rate cut, but disagreements among members on the path widened significantly (some even projected no cuts). Powell emphasized the non-linear nature of disinflation and warned about persistent upside risks from tariffs and energy prices, clearly stating the committee is in no rush to act and will remain cautiously on hold until inflation and employment data provide clear signals. The Fed raised its 2026 PCE inflation forecast to around 2.7%, above previous expectations, further dampening market pricing for rapid rate cuts this year and pressuring risk assets, including crypto, in late March.
U.S. Stock 市场 Performance
In March, U.S. stocks generally trended lower with volatility, performing noticeably weaker than at the start of the year. In late February, U.S. trade policy tightened again, with market uncertainty around tariffs causing repeated bouts of pressure on risk appetite. Entering March, escalating geopolitical tensions between the U.S. and Iran pushed Brent crude oil prices above $100 per barrel, a multi-year high. Coupled with recession warnings from several institutions, market sentiment deteriorated significantly. By mid-March, the S&P 500 had retreated from its early-year highs, and the VIX fear index spiked, reflecting a shift from tactical profit-taking to broader defensive de-risking by institutions. Within the tech sector, AI computing and infrastructure showed relative resilience, while traditional software and fintech faced valuation pressure, keeping overall risk premiums elevated.
Inflation Data
The U.S. Bureau of Labor Statistics released February 2026 CPI data on March 11: CPI rose 2.4% year-over-year, unchanged from January, with a 0.3% monthly increase; core CPI (excluding food and energy) rose 2.5% year-over-year and 0.2% monthly, both in line with market expectations. Inflation data overall remained above the Fed’s 2% target but did not accelerate further. Notably, services inflation remained sticky, while Middle East conflicts drove a rapid oil price surge, with Brent exceeding $100, creating renewed pressure from energy-side inflation. Consequently, the Fed raised its inflation forecast at the March FOMC meeting, acknowledging that the “last mile” is more challenging than expected, further increasing the necessity of keeping rates higher for longer in the near term.
Employment Data
The U.S. Labor Department’s February 2026 non-farm payroll report, released in early March, showed an unexpected decline of approximately 90,000 jobs—a rare post-pandemic contraction—significantly weaker than market expectations. The unemployment rate rose to around 4.4%, and the labor force participation rate edged down. The job decline was primarily influenced by strikes, government sector volatility, and slowing corporate hiring. The unexpected labor market weakness provided some support for rate cut expectations, but the coexistence of sticky inflation and weakening employment—a “stagflationary signal”—placed the Fed in a dilemma: cutting rates could fuel inflation, while holding steady could worsen the economic slowdown. Market expectations for the timing of the first rate cut this year have largely shifted to the second half of the year.
Political Factors
In March, multiple layers of political and policy uncertainty intertwined, significantly impacting market sentiment. U.S. trade policy remained volatile, with tariff uncertainty disrupting corporate earnings and supply chains. Simultaneously, escalating U.S.-Iran geopolitical tensions constituted the largest exogenous risk of the period, with oil prices exceeding $100 directly lifting inflation expectations and dampening consumer confidence. In the crypto space, regulatory discussions on asset classification and legislative frameworks continued, with the market maintaining some optimism about the long-term compliance process, but macro factors still dominated short-term pricing. Gold prices rose further during the period, staying near historical highs, reflecting persistent safe-haven demand. Overall, geopolitical risks, tariff uncertainty, and the FOMC’s hawkish stance formed a triple pressure, with political factors having an overall negative impact on crypto market sentiment.
Outlook for Next Month
Looking ahead to April, the market will focus on March CPI and PCE inflation data and the March non-farm payroll report, which will directly influence the Fed’s policy judgment at the May FOMC meeting. Notably, the combination of February’s weak employment and oil prices above $100 has made “stagflation” concerns a core market narrative. If March data continues this pattern, risk assets will remain under pressure. The trajectory of U.S.-Iran geopolitical tensions is also a key variable for April; further escalation would reinforce inflation stickiness and increase market volatility. Additionally, Fed Chair Jerome Powell’s term expires in May 2026, and uncertainty around his successor will gradually become a market focus. For crypto assets, regulatory legislative progress (e.g., the pace of the CLARITY Act) and BTC spot ETF fund flows remain core variables. Whether BTC can hold key support levels and maintain net inflows will determine the direction of the next phase of the market.
2. Crypto Market Overview
Coin Data Analysis
Volume & Daily Growth Rate
According to CoinGecko data, overall market trading volume in March exhibited a distinct “spike-and-quick-retreat” pattern, with volatility significantly higher than in February. Volume surged to a phase high (around $170 billion) from the start of the month to March 4, then rapidly declined. Mid-month, volume spiked again driven by market sentiment and events, with a single-day increase of 101% on March 16, but sustainability remained lacking, followed by another contraction. In terms of rhythm, volume surges were highly concentrated around short-term sentiment catalysts or event shocks (e.g., heightened market volatility or on-chain/security incidents), while volume remained at low-to-mid levels at other times, reflecting capital primarily engaged in short-term speculation and trading, with a continued absence of medium-to-long-term incremental capital. Volume weakened further in late March, accompanied by multiple large negative growth days (e.g., -45%, -24%), indicating a marginal decline in market activity. Overall, while March saw stronger explosive volume surges at specific points compared to February, the lack of continuity indicates the market has not yet formed a stable uptrend in volume, with structural and event-driven moves still dominating.

Total Market Cap & Daily Change
According to CoinGecko data, the total crypto market capitalization in March showed a structure of “oscillating upward followed by a pullback and stabilization.” Starting around $2.3 trillion at the beginning of the month, it gradually recovered, reaching a phase high around $2.63 trillion in mid-March. Daily changes during this period were relatively mild, mostly within ±3%, indicating recovery but still cautious sentiment. Compared to February, March’s market cap movement was more stable, without extreme single-day plunges, reflecting a temporary easing of systemic risk. However, after the mid-month peak, the market cap retreated again, oscillating repeatedly within the $2.45–$2.50 trillion range, showing weakened growth momentum. Overall, the market is currently in a consolidation phase post-recovery, lacking strong upward trend momentum. Risk appetite is still in a recovery process, and future direction will depend on improved macro liquidity, sustained ETF inflows, and further policy catalysts.
3. On-Chain Data Analysis
BTC & ETH ETF Inflow/Outflow Analysis
BTC spot ETF fund flows strengthened significantly in March, showing a turning point from net outflows to net inflows. BTC spot ETFs achieved net inflows of approximately $8.44 billion for the month, with total net assets rising from about $81.3 billion on February 24 to $89.74 billion, a sequential increase of about 10.3%. Price-wise, BTC rose from around $64,068 at the start of the month to $67,842, a gain of about 5.8%. Overall, the return of ETF inflows and price recovery formed a positive feedback loop, indicating some repair in institutional risk appetite. Compared to the concentrated outflows in February, March resembled a phase of reallocation. On one hand, marginal improvements in macro liquidity eased pressure on risk assets; on the other, BTC’s valuation became attractive after the earlier significant correction, prompting institutions to rebuild exposure. This resulted in a recovery characterized by “capital return + price stabilization.”
ETH spot ETFs also showed significant improvement in March, shifting from outflows to inflows. ETH spot ETFs saw net inflows of approximately $1.75 billion for the month, with total net assets growing from about $10.47 billion to $12.22 billion, a sequential increase of 16.7%. The ETH price rose from $1,852 to $2,052, a gain of about 10.7%. In terms of performance, ETH’s capital return magnitude and price elasticity were both higher than BTC’s, reflecting that during a phase of marginal recovery in risk appetite, capital tends to flow back into higher-volatility assets. As an asset that was prioritized for reduction in February, ETH became a priority for recovery in March. However, its overall scale has not yet returned to previous highs, indicating that institutions are currently engaging more in tactical rebalancing rather than full-fledged long-term allocation, maintaining a degree of caution.

Stablecoin Inflow/Outflow Analysis
Regarding stablecoins, the overall circulating supply increased from approximately $278.668 billion to $283.611 billion in March, a sequential growth of about 1.7%, shifting from a slight contraction in February to mild expansion, indicating marginal improvement in market liquidity. Structurally, USDT grew by about 0.5%, maintaining its dominant position; USDC grew by about 5.9%, the most significant increase, reflecting that compliant stablecoins were favored during the capital return phase; DAI grew by about 3.6%, showing relative stability. Meanwhile, USDE, PYUSD, and USD1 declined by about 2.9%, 0.8%, and 10% respectively, with USD1 showing the most significant contraction, indicating continued pressure on demand for some non-mainstream or ecosystem-specific stablecoins. Overall, while stablecoins expanded, capital clearly concentrated towards the top-tier, with structural divergence intensifying.
In summary, March exhibited typical recovery characteristics: Both BTC and ETH spot ETFs shifted from net outflows to net inflows, with asset size and prices recovering in tandem; the total stablecoin supply shifted from contraction to expansion, confirming that new capital is re-entering the market. However, structurally, capital remains concentrated in mainstream assets and stablecoins, indicating the current phase is one of cautious recovery in risk appetite, driven more by capital rebalancing rather than a comprehensive, trend-driven bull market.
4. Price Analysis of Major Cryptocurrencies
Bitcoin (BTC) Price Analysis
In March, Bitcoin’s price experienced wide fluctuations within a $62,000–$74,000 range. After a short-term rebound to around $69,000 on February 25 following the end of five consecutive weeks of net outflows, BTC entered a consolidation phase. Key resistance was concentrated around $72,000–$75,000, which was tested multiple times during the month without a decisive breakout. Key support was concentrated around $65,000–$67,000, with a brief test down to the $63,000–$64,000 level followed by a quick recovery. After the hawkish FOMC statement on March 18, BTC fell about 5% in a single day, testing the $67,000–$68,000 support again. As of March 27, it was trading around $69,000–$71,000, still within the range. A decisive breakout and hold above $74,000 could open the path for a recovery towards $78,000–$82,000. Conversely, a break below $65,000 could lead to a further test of the $60,000–$62,000 medium-term support. Overall, Bitcoin is currently in a range-bound pattern, with $65,000–$67,000 as the main support and $72,000–$75,000 as the near-term resistance zone. A clear directional breakout signal still requires improvement in the macro environment.

Ethereum (ETH) Price Analysis
In March, Ethereum’s price continued a relatively weak and volatile pattern, underperforming Bitcoin overall. After rebounding from around $2,050 in late February, ETH entered a consolidation phase, mainly trading between $1,900–$2,200. As of March 27, it was trading around $2,100–$2,200. The key overhead resistance is first concentrated around $2,250–$2,350, an area corresponding to short-term dynamic moving averages and previous congestion zones that have repeatedly capped upward moves. The $1,900–$2,000 range serves as important support; a break below could lead to a further test of the $1,700–$1,800 medium-term key support. Following the hawkish FOMC signals on March 18, ETH faced short-term pressure, and slowing ETF inflows further dampened rebound momentum. The ability to gradually move and hold above $2,200 with increased volume will be a key indicator for judging whether the trend can shift from weak to strong. The short-term technical picture remains neutral to weak.

本文来源于互联网: BitMart VIP Insights: March Crypto Market Review and Hotspot Analysis
Related: BitMart Research Weekly Highlights: Geopolitical Impact Cools, BTC Opens Upward Space
Macro Economy and Traditional Financial Markets (Macro) 1. Geopolitics and the Crude Oil Market The Middle East situation (Israel, Iran, and the Strait of Hormuz) remains the core macro variable. Crude oil prices have stabilized around $100 after significant volatility. The prevailing market expectation is that this round of conflict is expected to ease within 2-6 weeks, likely leading to a ceasefire agreement. As the VIX (fear index) retreats, market risk appetite is gradually recovering. 2. Economic Data and “Stagflation” Concerns US GDP growth for the last quarter slowed more than expected to 0.7%, primarily dragged down by weaker exports, real estate investment, and Personal Consumption Expenditures (PCE). Combined with recent weak retail data, signals of cooling economic momentum are clear. Although rising oil prices and slowing growth have raised…