4 Classic Bottom Fishing Indicators All Fail, Do 3 New Indicators Signal the Bottom?
Author|Wenser (@wenser 2010)

After experiencing eight consecutive days of gains, BTC has once again reversed course, declining continuously from $76,000 and is currently reported at $69,200. The mainstream buy-the-dip indicators commonly referenced within the industry, including Ahr999 (also known as the “9 God Index”), weekly RSI, STH-SOPR (Short-Term Holder Spent Output Profit Ratio), LTH (Long-Term Holder cost basis), and MVRV Z-Score, have all shown inconsistent reliability: many indicators remain at low levels, yet the market continues to fall; some indicators are at high levels, but the market occasionally surges.
In light of this, this article will present four representative buy-the-dip indicators within the industry and attempt to construct a new “buy-the-dip indicator” by combining data and “implicit indicators” from real life, aiming to explore BTC’s potential downside. The following content is for learning and discussion purposes only and does not constitute investment advice. All investment risks are borne by the individual. Please DYOR.
4 Classic Indicators for BTC Buy-the-Dip Timing: The Best Time Has Not Arrived, BTC May Fall Below $60k
From the new high of $126,000 in October last year to the current fluctuations around $70,000, BTC’s price has been on a rollercoaster ride in just a few months. In such a volatile crypto market environment, many industry indicators have lost their reference value, including but not limited to the dynamic and flexible Bitcoin miner shutdown price, the Crypto Fear & Greed Index, Google search trend index, and the Rainbow Chart based on BTC’s early adoption phase.
The reason is simple: after the influx of BTC spot ETF funds, the increasing number of U.S. corporate treasuries holding BTC, and the opening of doors by U.S. regulators, BTC’s valuation framework has undergone a structural change. Institutional holdings, derivatives arbitrage, internal exchange settlements, U.S. macroeconomic monetary policy, and even global geopolitics have become factors with higher weight in influencing BTC’s price. In other words, past on-chain indicators and profit/loss metrics can only serve as references and no longer yield direct conclusions.
Here, we use industry indicators that still hold some representativeness for data presentation and result analysis, which may more intuitively illustrate the current ineffectiveness of old indicators.
Indicator One: MVRV Z-Score, Collective Shift in Anchored Value System
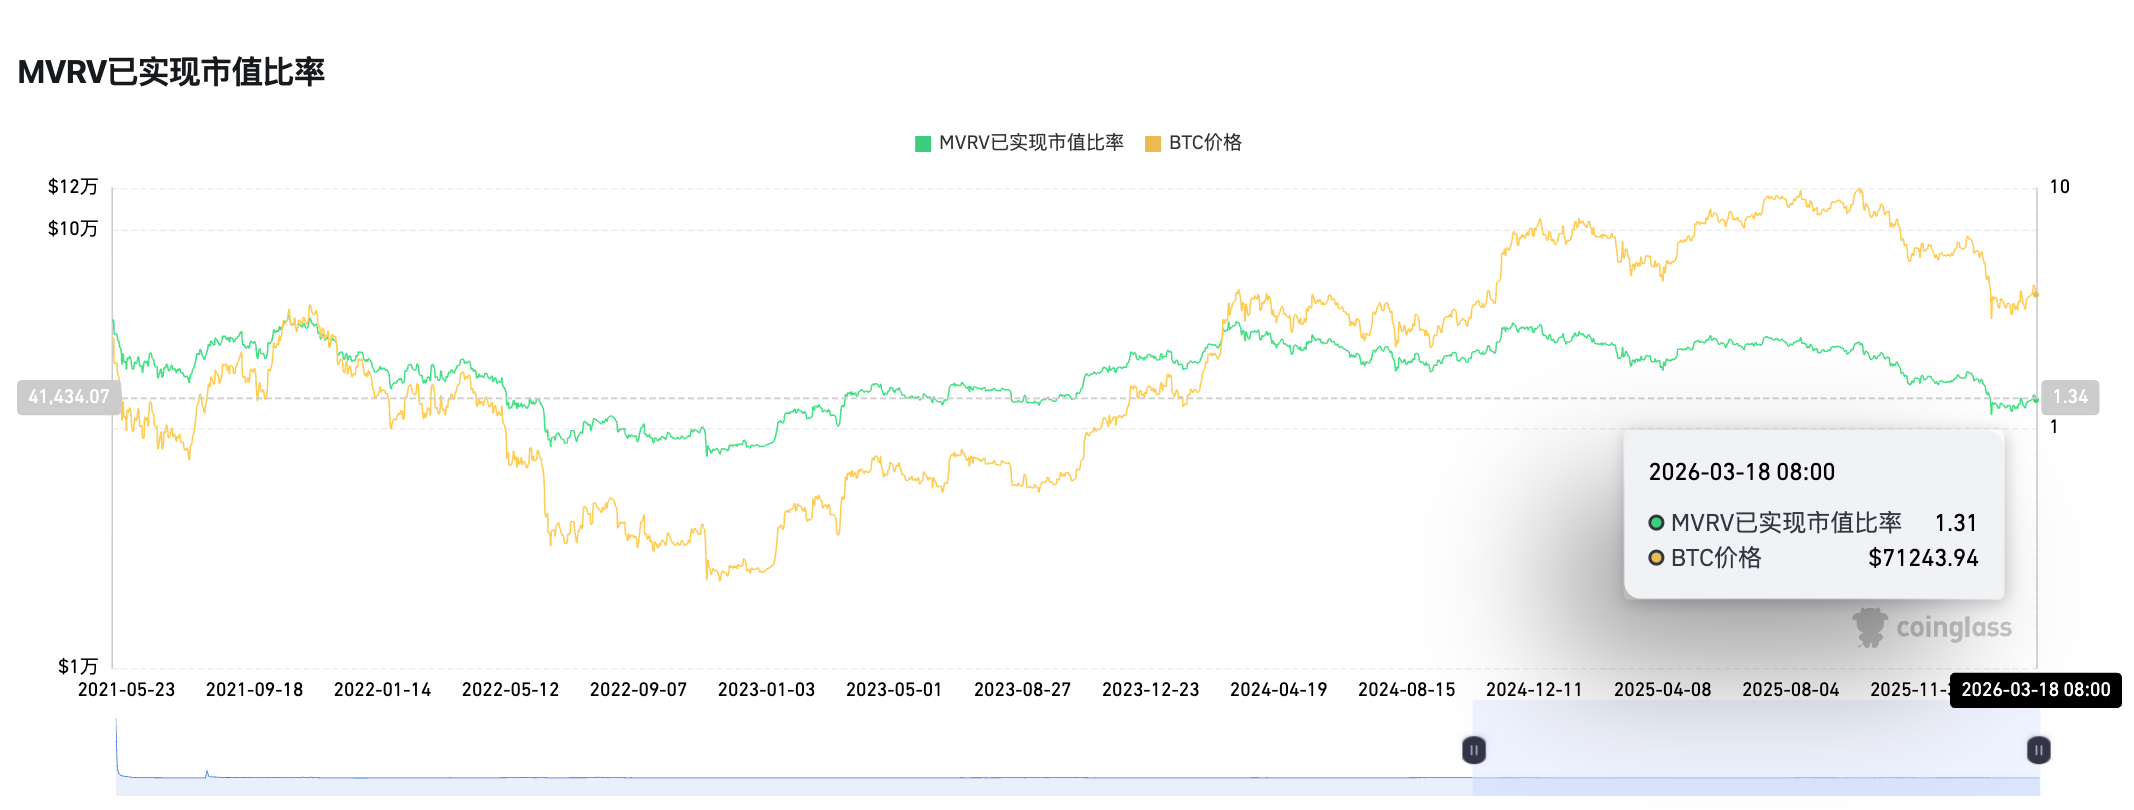
Figure 1

Figure 2
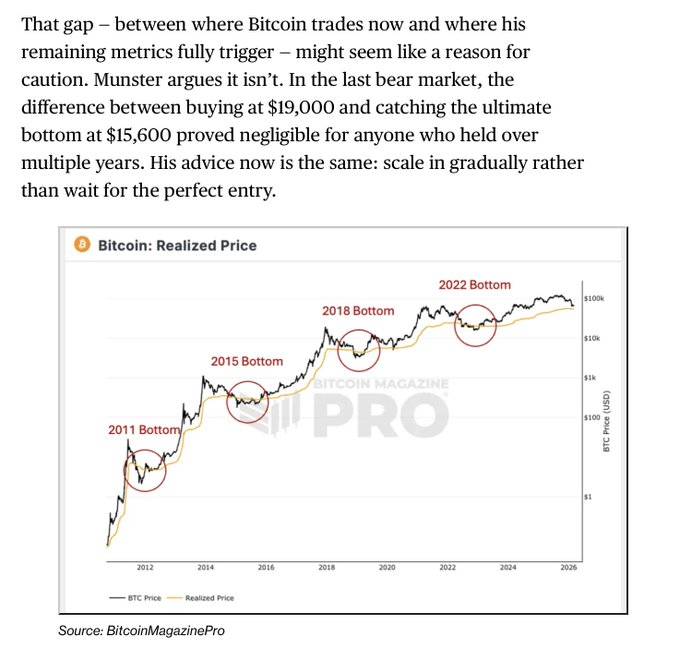
Figure 3
As of March 18, the MVRV indicator is reported at 1.31. Previously, in February, crypto researcher anıl pointed out, “When the MVRV Z-Score falls below 0, especially below -0.20, Bitcoin is at its price bottom. In this cycle, the lowest value Bitcoin touched was +0.26, meaning the classic ‘green zone’ has not been tested.” (Figure 2 above) On March 14, Bitcoin News published an article stating that the MVRV Z-Score had dropped to around 0.38, a level that previously signaled undervaluation. Other key support levels include the realized price near $54,000 and the 200-week moving average near $58,000. Bloomberg indicated that the potential bottom range is between $45,000 and $55,000, but sustained recovery requires new demand support. (Figure 3 above)
Reason for Ineffectiveness: Large-scale holdings by ETF custodians and corporate treasuries have systematically raised the Realized Value (RV), significantly increasing the denominator (standard deviation) of the Z-Score. Historically “extreme negative values” are now extremely difficult to replicate under the current structure.
Indicator Two: Ahr999 Index (9 God Index), Buy-the-Dip Zone Below 0.45 Has Lasted Nearly 50 Days


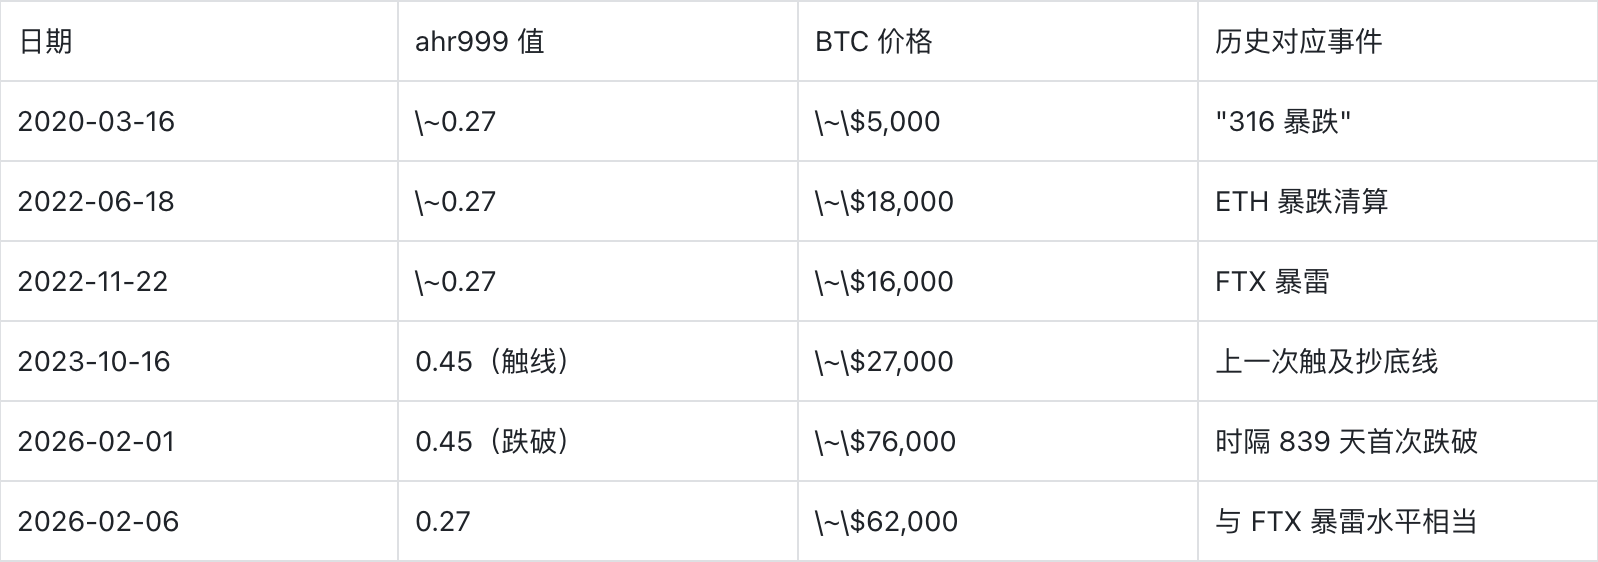
From February 1st to the present, the Ahr999 indicator has remained below 0.45 for nearly 50 consecutive days. Historically, the number of days this indicator has been
Reason for Ineffectiveness: Since the major crash on October 11 last year, the market has been in a state of persistent oversold conditions. Coupled with Trump’s unpredictable policies, the Federal Reserve’s interest rate cuts falling short of expectations, and international geopolitical turmoil, BTC’s safe-haven attributes have significantly diminished. Therefore, even after falling below the $76,000 cost line of the largest publicly traded BTC holding company, Strategy, the market still awaits more liquidity repair. This indicator has gradually become a comfort index for “long-term value investors.”
Indicator Three: SOPR, STH-SOPR Consistently Below 1, LTH-SOPR Persistently Between 0.75-1
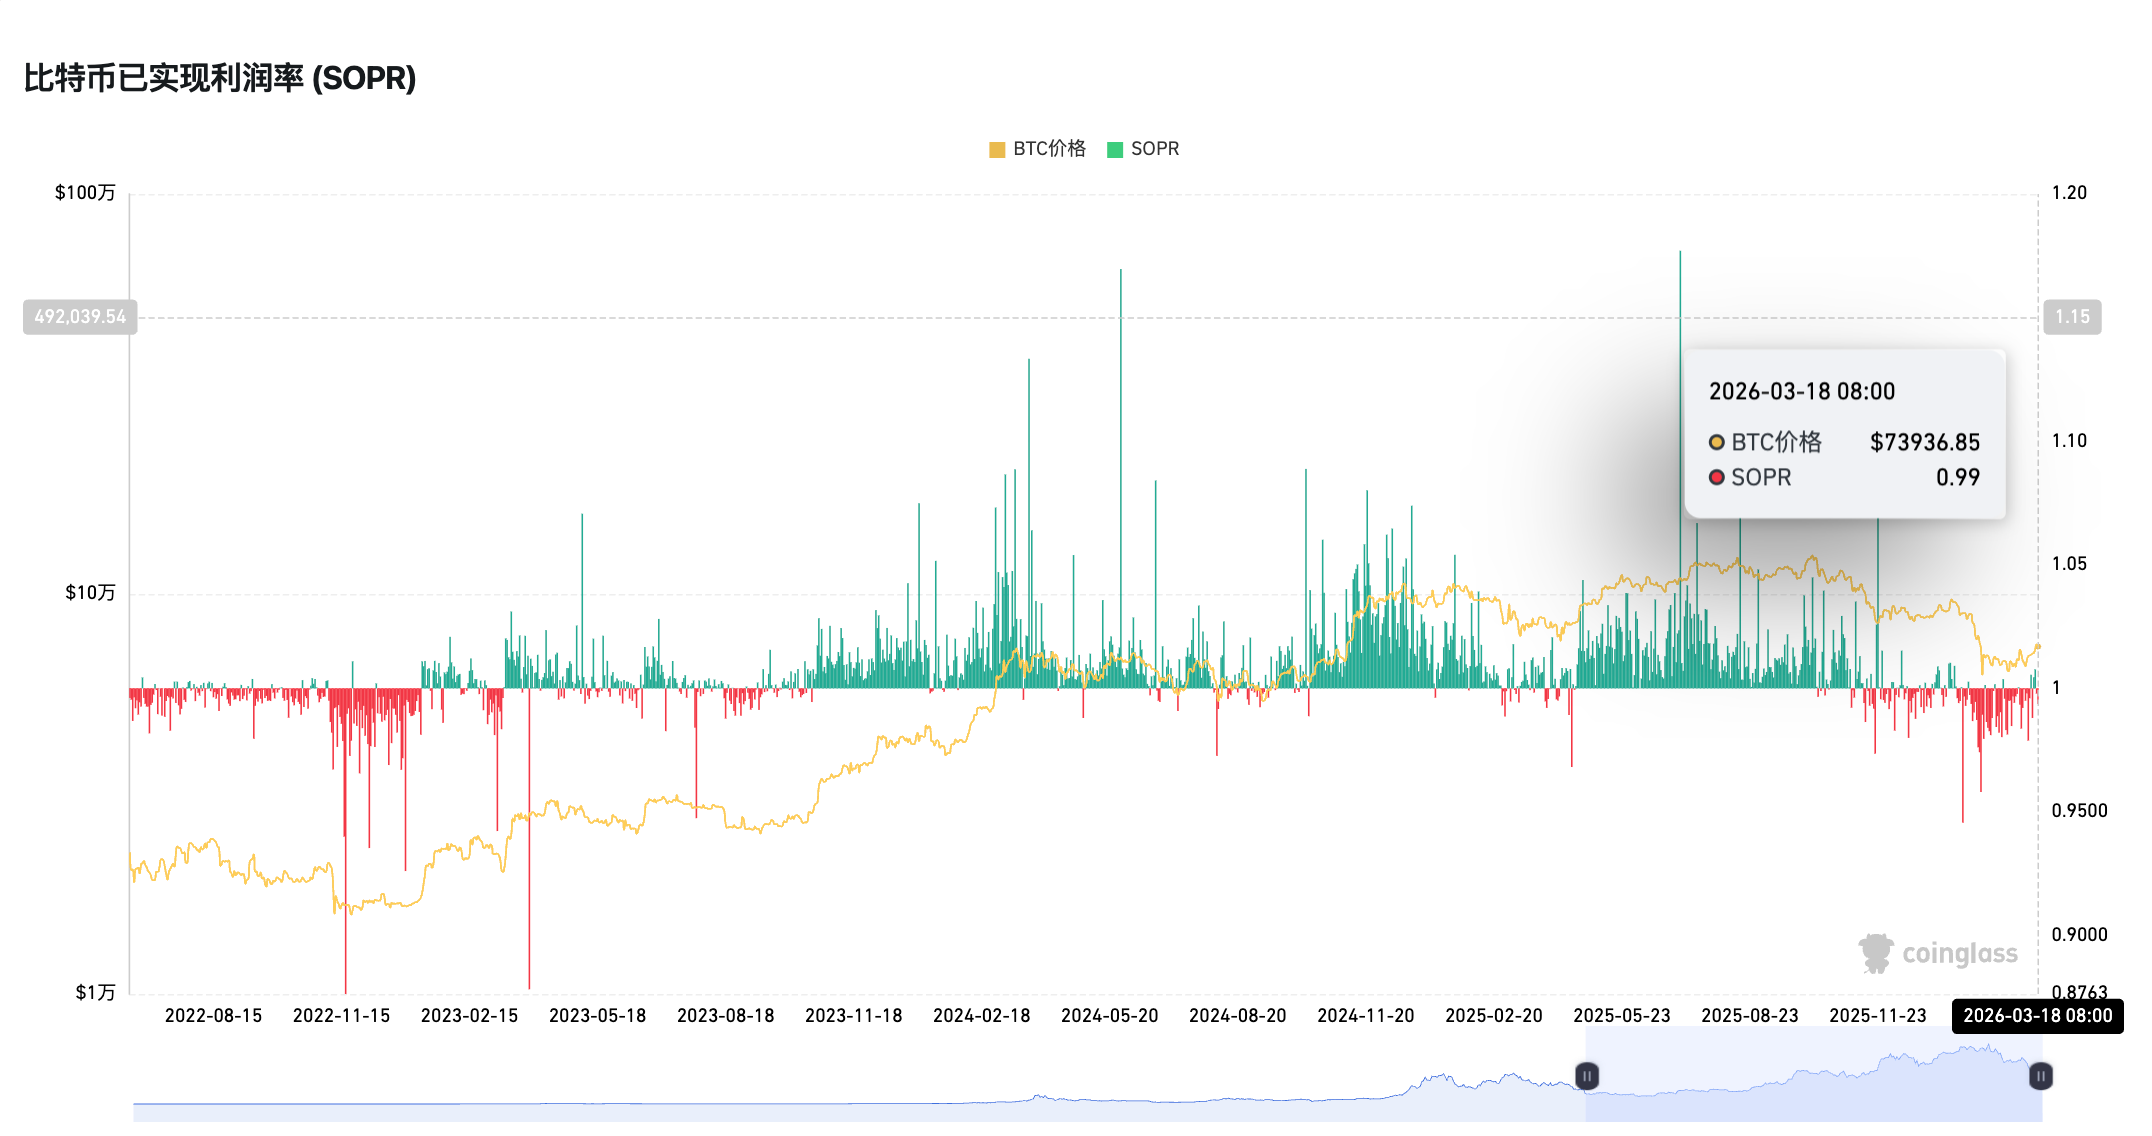
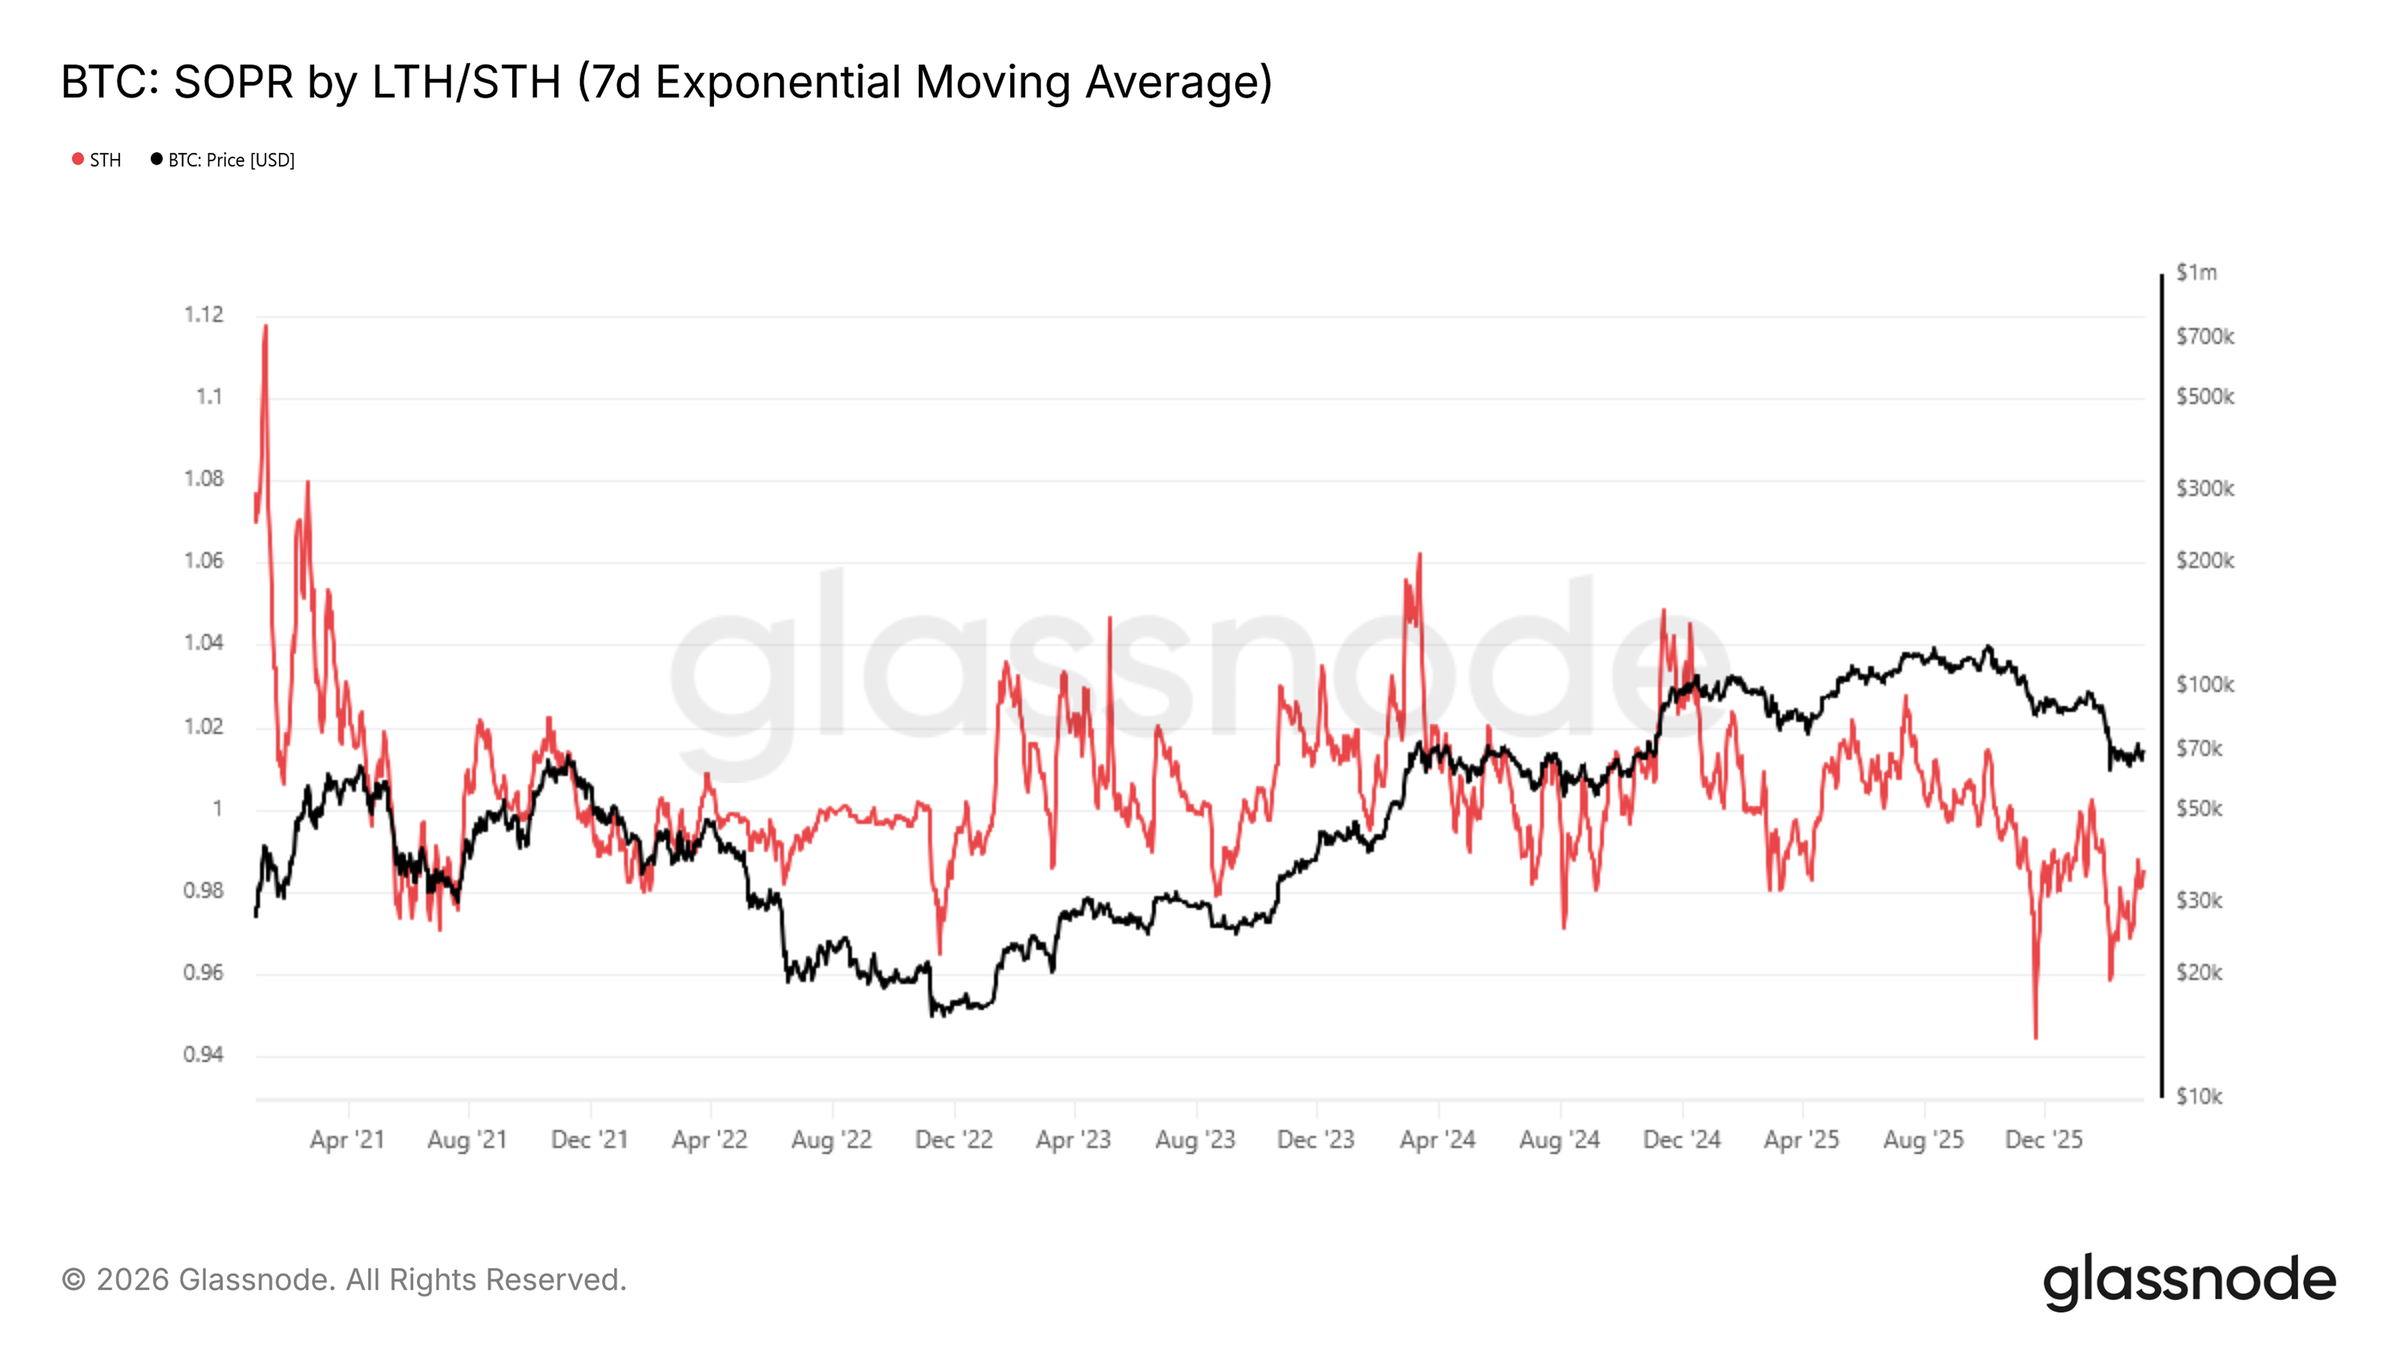

SOPR (Spent Output Profit Ratio) is typically used to measure the average profit/loss ratio of on-chain moving coins. LTH-SOPR focuses on long-term holders holding for over 155 days. LTH-SOPR falling below 1 usually represents old coins starting to stop-loss and sell, historically corresponding to deep bear market bottoms.
In February, Bitfinex published an analysis report stating that on-chain indicators show the Adjusted SOPR had fallen to the 0.92–0.94 range, reflecting that most coins were transferred at a loss, and structural pressure remains.
On March 14, Glassnode’s weekly report also pointed out that the 7-day moving average of STH-SOPR is at 0.985, having been continuously below 1 for longer than since October 2025—a typical characteristic of a bear market regime. This is a significant feature of a bear market cycle. Meanwhile, the net position change of LTHs shows that old coins are still decreasing, but the pace has significantly slowed, shifting from aggressive distribution in Q3/Q4 2025 to a more moderate profit-taking mode.
Manifestation of Ineffectiveness: A decline without old coin capitulation does not constitute a traditional cycle bottom. STH-SOPR consistently below 1 confirms a bear market, but the turning point of LTH-SOPR is the true leading indicator for the bottom.
Indicator Four: BTC Mayer Multiple, Below 0.8 for Nearly 50 Days
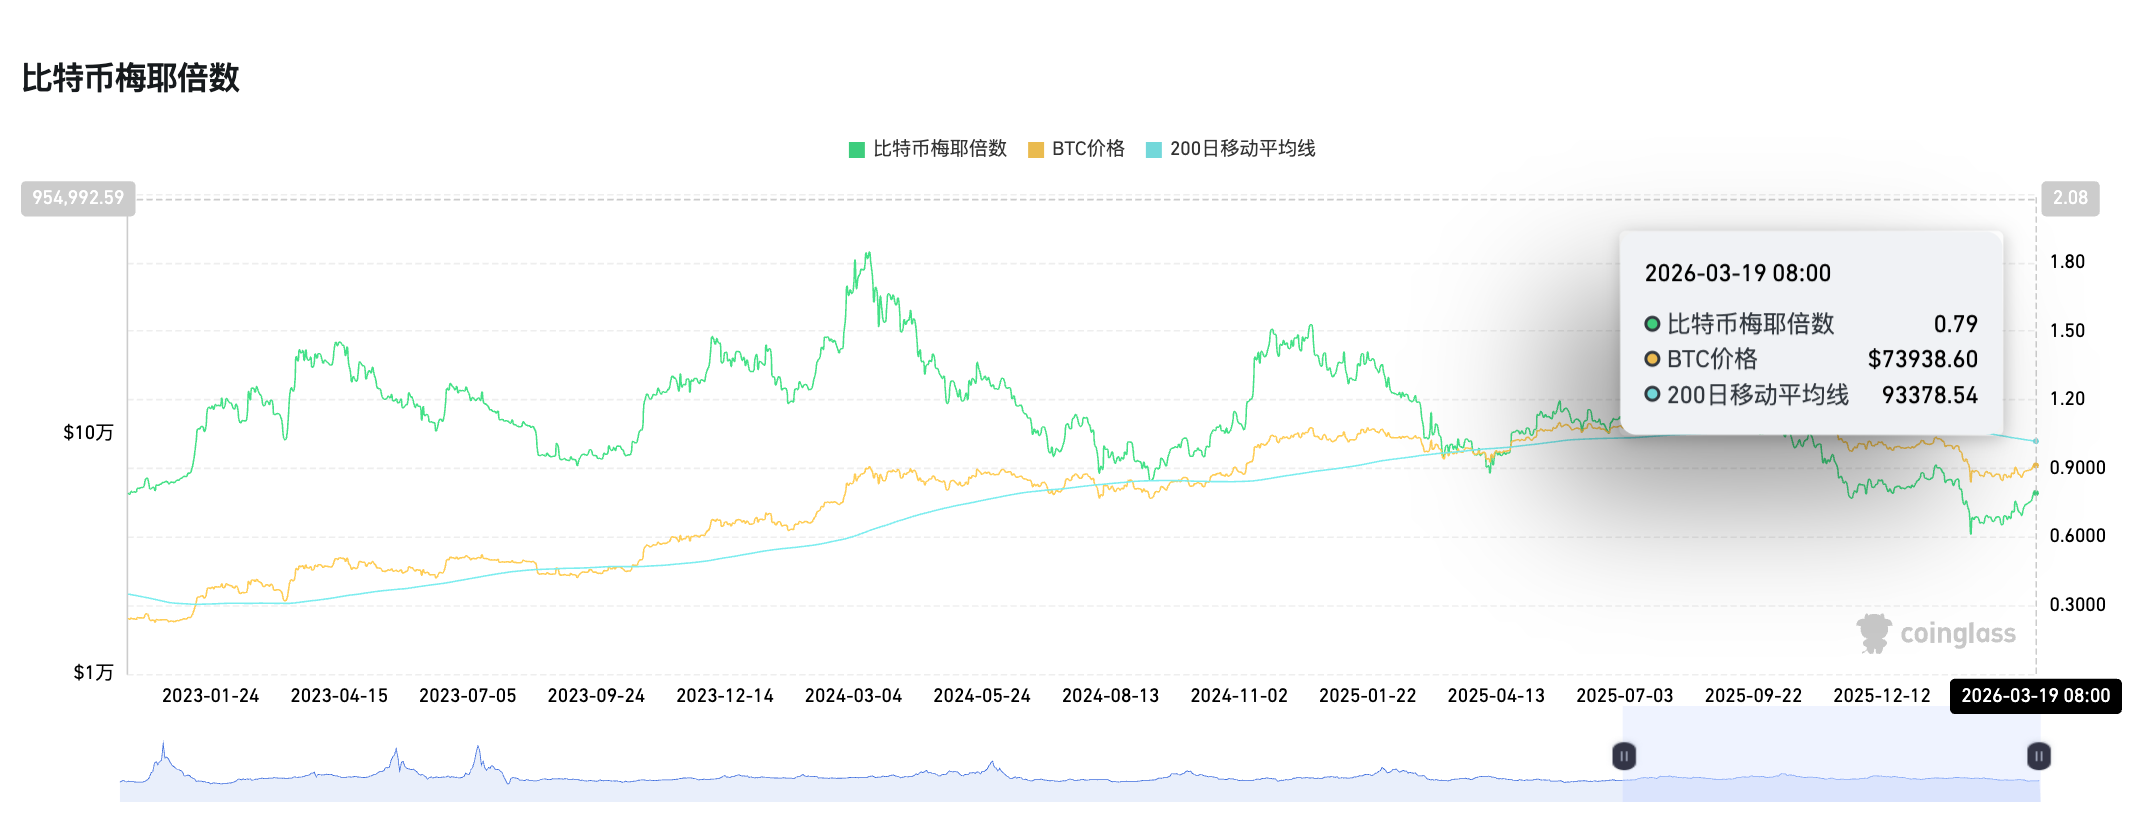
As an industry indicator derived solely by comparing BTC’s current price to its 200-day moving average, the BTC Mayer Multiple, similar to the 9 God Index, has remained below 0.8 for nearly 50 days. Historically, a value
3 Indicators That May Reveal Bear Market Buy-the-Dip Zones: CVDD Iron Bottom, Negative NUPL, Stablecoin Exchange Inflows
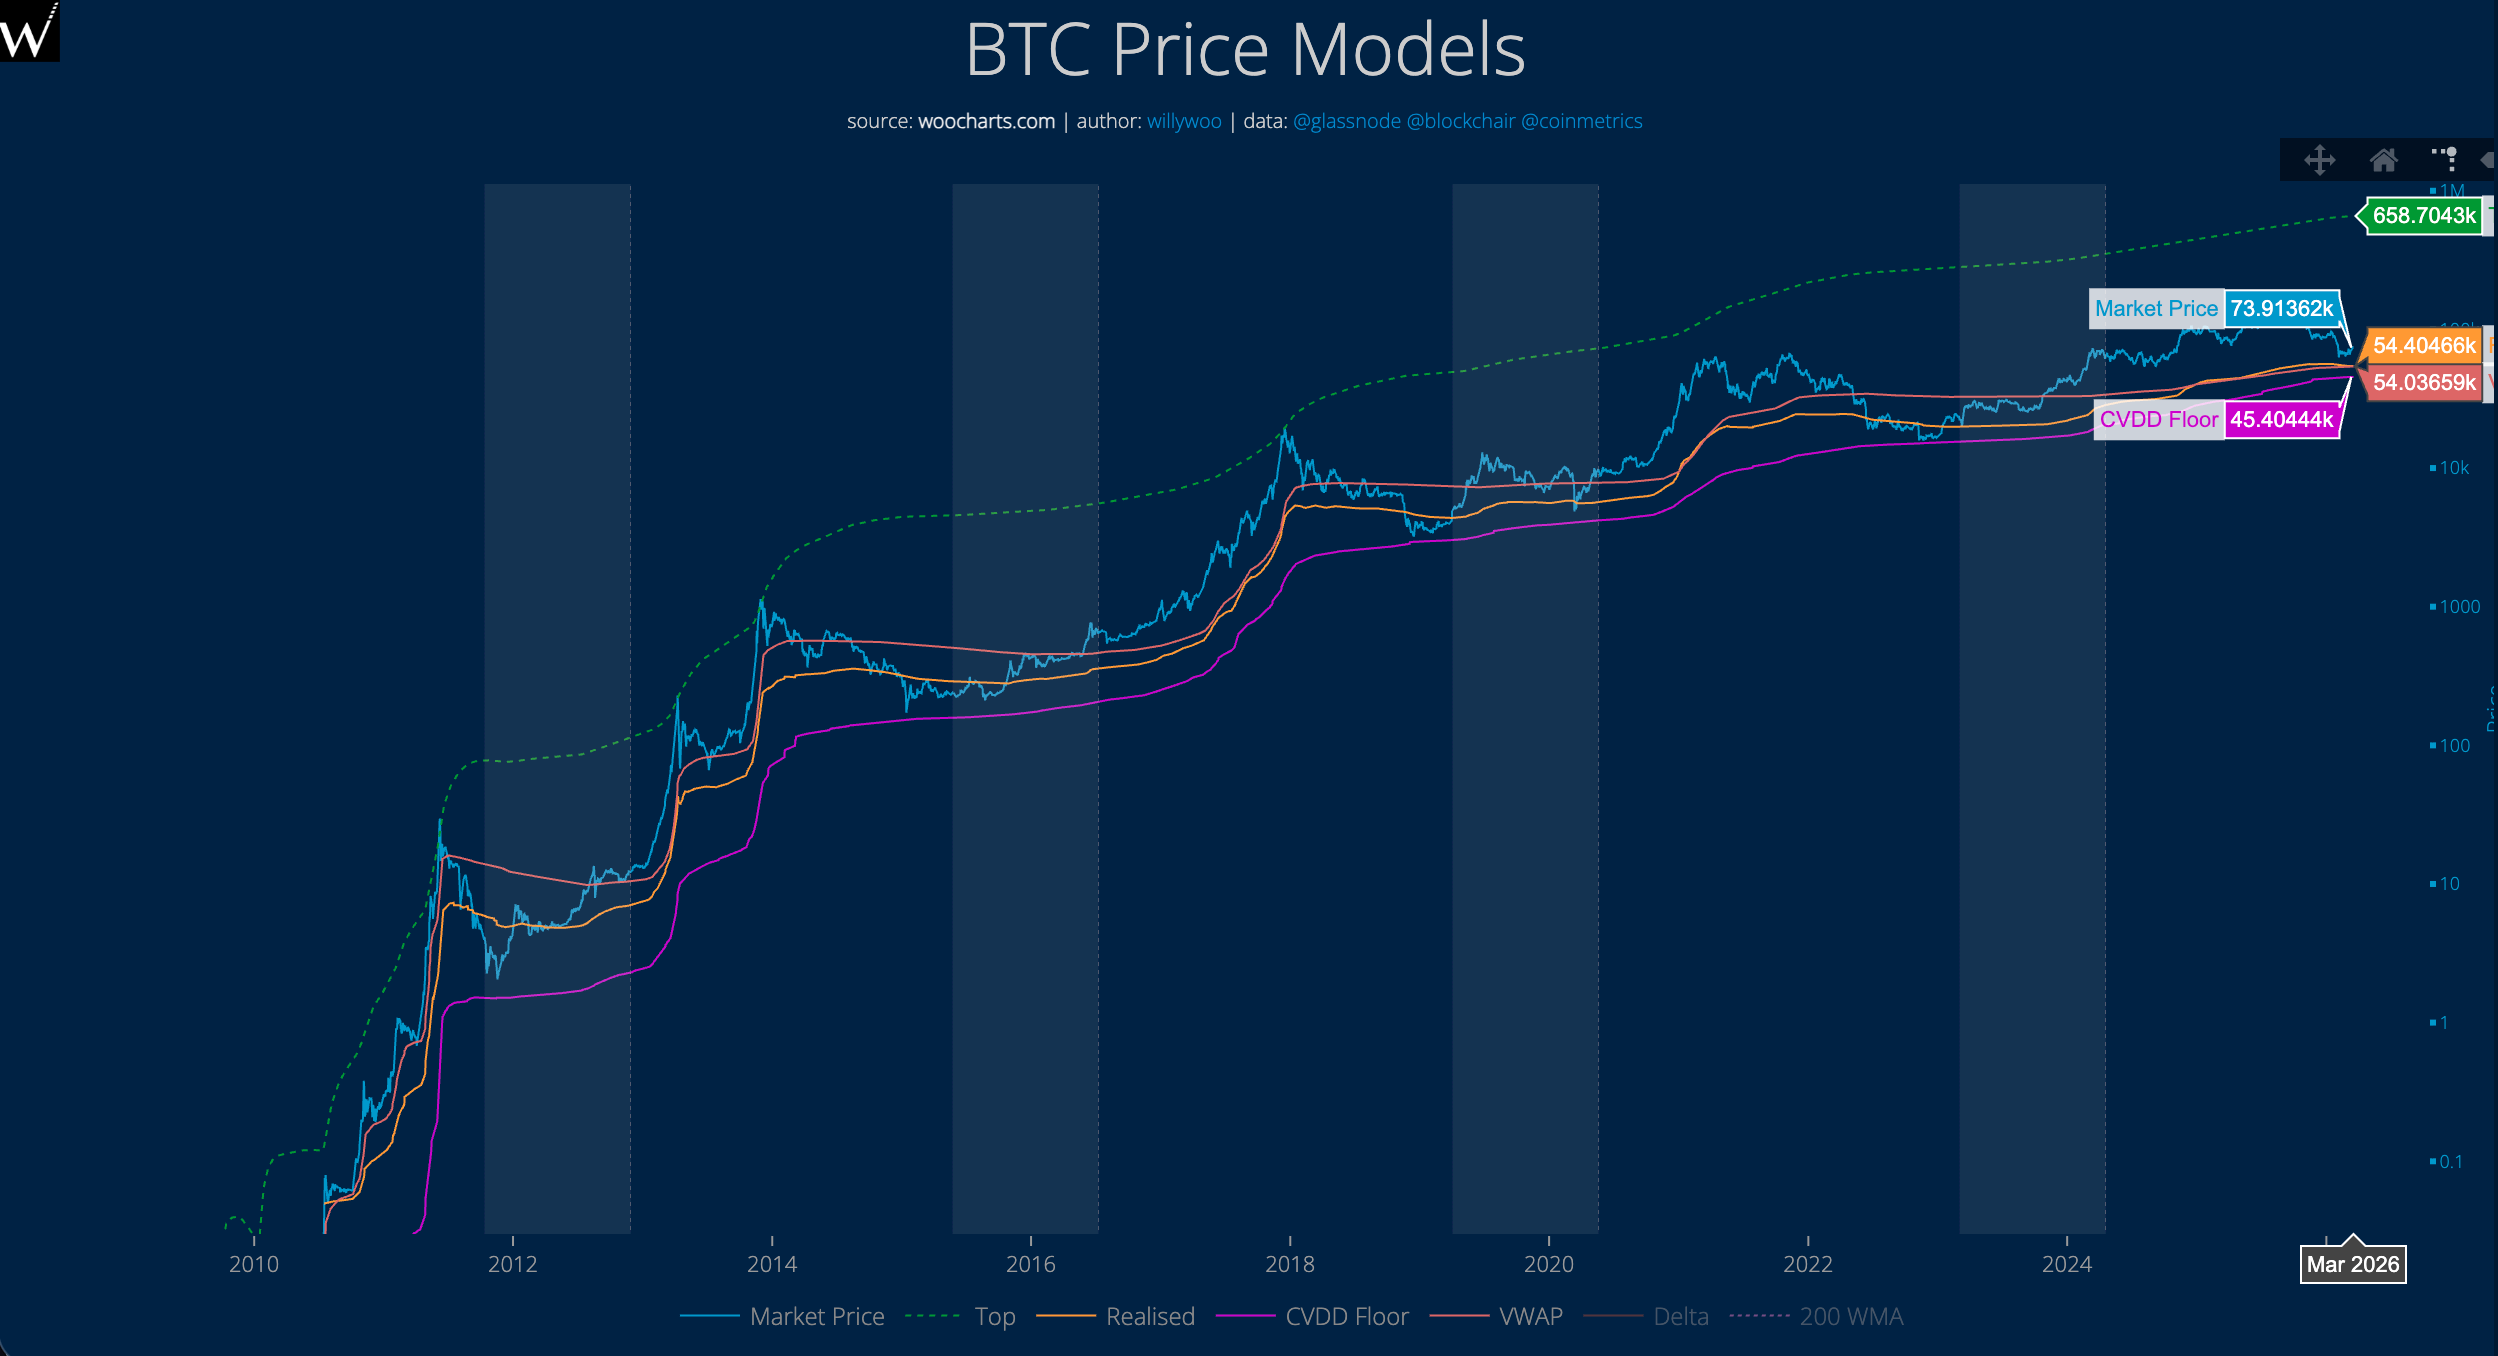
CVDD (Cumulative Value Days Destroyed): An Analyst’s Personal Iron Bottom Model
This indicator was developed by crypto analyst Willy Woo to track the cumulative holding weight of BTC across different price ranges, constructing a “historical iron bottom” curve.
It is worth mentioning that this curve approached the BTC market price twice, in December 2018 and November 2022, but has never been broken below to date.
Currently, the CVDD model shows the current BTC iron bottom is approximately $45,000.
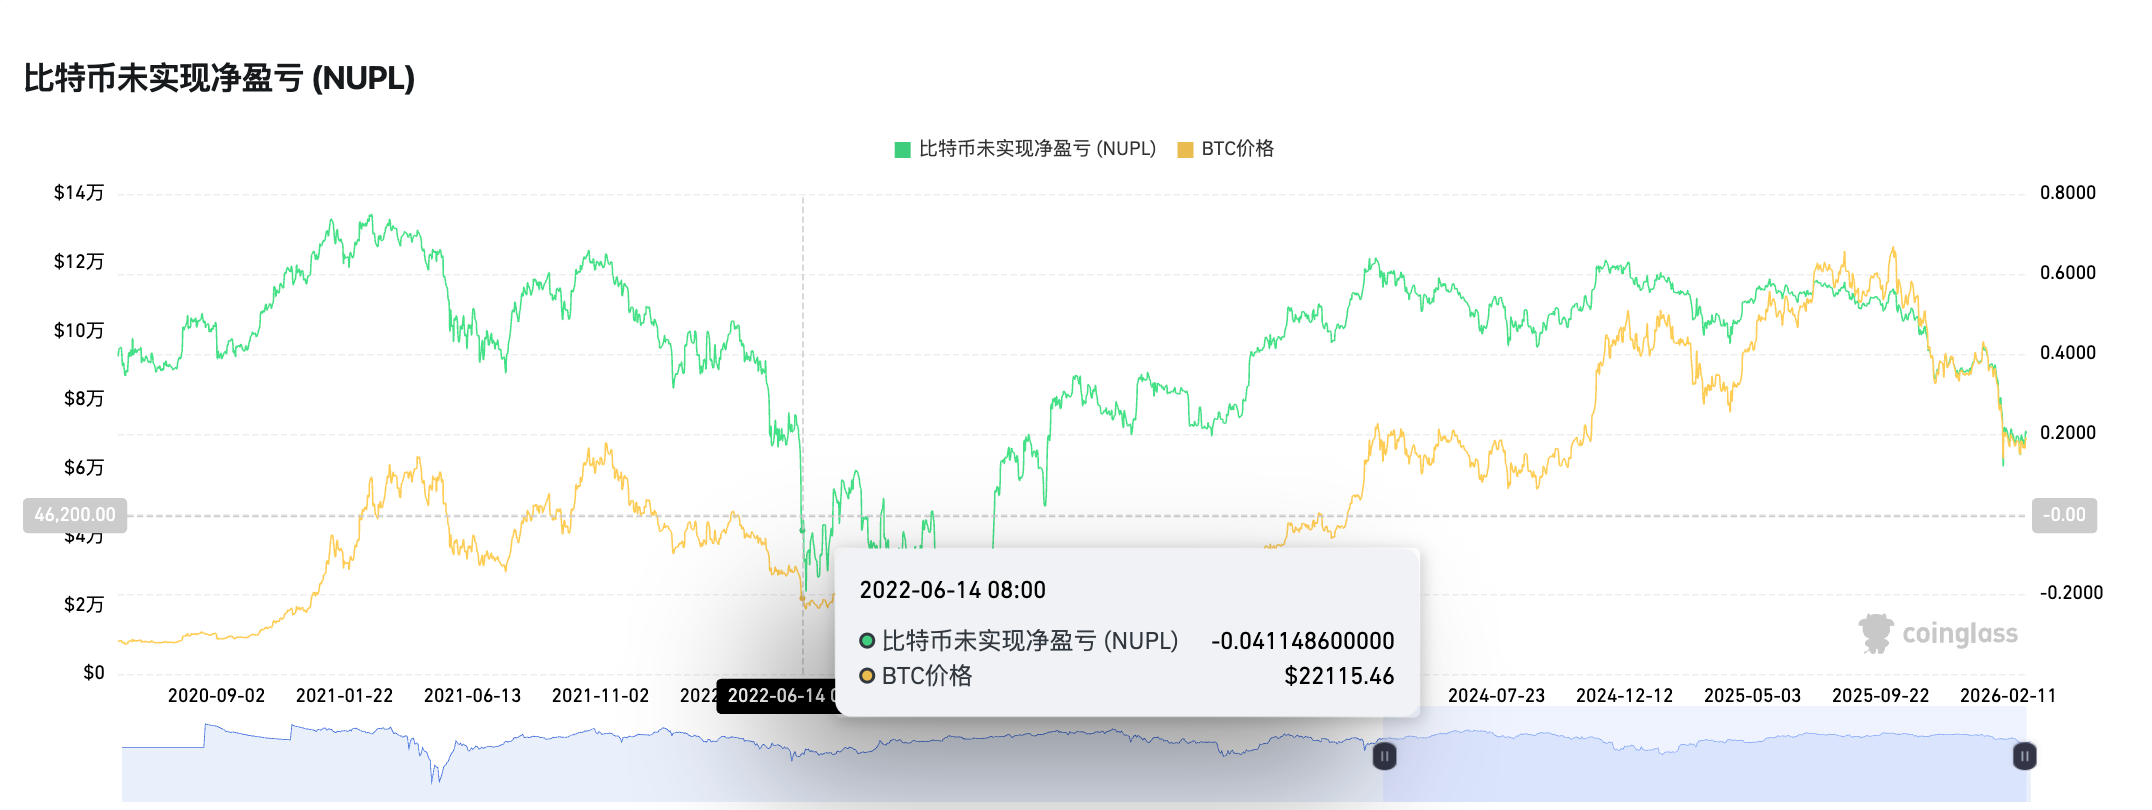
NUPL (Net Unrealized Profit/Loss): BTC Network-wide Net Profit/Loss
This indicator is primarily used to measure the net value of unrealized profit/loss across the entire network. The general judgment criteria are as follows:
High NUPL (>50%): Greed-driven peaks; ideal for profit-taking.
Low NUPL (
It is worth noting that the NUPL indicator last fell into negative territory during the period from June 2022 to January 2023.
Currently, the NUPL indicator remains around 0.2.
Stablecoin Exchange Netflow: Stablecoin Net Inflows to Exchanges
This indicator is primarily used to judge whether stablecoins are flowing back into exchanges, a leading signal for impending market buying pressure. Historically, a sustained recovery in stablecoin net inflows often precedes a substantial BTC price rebound by 2–4 weeks.
The logic behind this indicator’s effectiveness is that a price rebound without stablecoin inflows is merely a leverage-driven technical bounce with very low sustainability.
Currently, USDT and USDC, which account for about 80% of the stablecoin market share, are still experiencing continuous outflows, indicating that the BTC bottom is still some distance away.


Conclusion: Buy When No One Asks, Sell When Everyone Talks
At the end of the article, we must reiterate that the various indicators mentioned above are for reference only. Specific trading and investment strategies vary depending on each individual’s or institution’s different risk preferences, capital size, and holding periods.
However, compared to buy-the-dip indicators, perhaps the exit indicators in the crypto industry are more flexible—just like the recent surge in gold and silver that caught everyone’s attention. Once the discussion frenzy around BTC spreads to your surroundings, whether it’s the vegetable-buying auntie on the subway or the barber Tony, when they all start asking you about BTC, Crypto, or cryptocurrency investments, perhaps timely selling will be the only best choice.
We hope each of us can wait for that day and initiate “our own great retreat.”
This article is sourced from the internet: 4 Classic Bottom Fishing Indicators All Fail, Do 3 New Indicators Signal the Bottom?
1. Background With the rapid development of large language model (LLM) technology, AI Agents are evolving from simple intelligent assistants into automated systems capable of autonomously executing tasks. This transformation is particularly evident within the Web3 ecosystem. An increasing number of users are beginning to experiment with AI Agents for market analysis, strategy generation, and automated trading, turning the concept of a “7×24 automated trading assistant” into a tangible reality. Following the launch of multiple AI Skills by Binance and OKX, Bitget has also introduced the Skills resource hub, Agent Hub. Agents can now directly integrate with trading platform APIs, on-chain data, and market analysis tools, thereby taking on some of the trading decision-making and execution tasks that were previously handled manually. Compared to traditional automated scripts, AI Agents possess…