The revelation of the interest rate cut cycle: looking at the structural opportunities in the crypto market from histori
Judging from historical experience, the answer is a high probability, but the price will not rise as soon as the interest rate is cut.
Intuitively, the market equates an interest rate cut with a release of liquidity and upward asset prices. However, a look back over the past three decades reveals that the Fed’s rate cuts are far more complex than they appear. Sometimes they are preventative measures to address potential problems, and other times they are emergency bailouts to shore up the economy during a crisis.
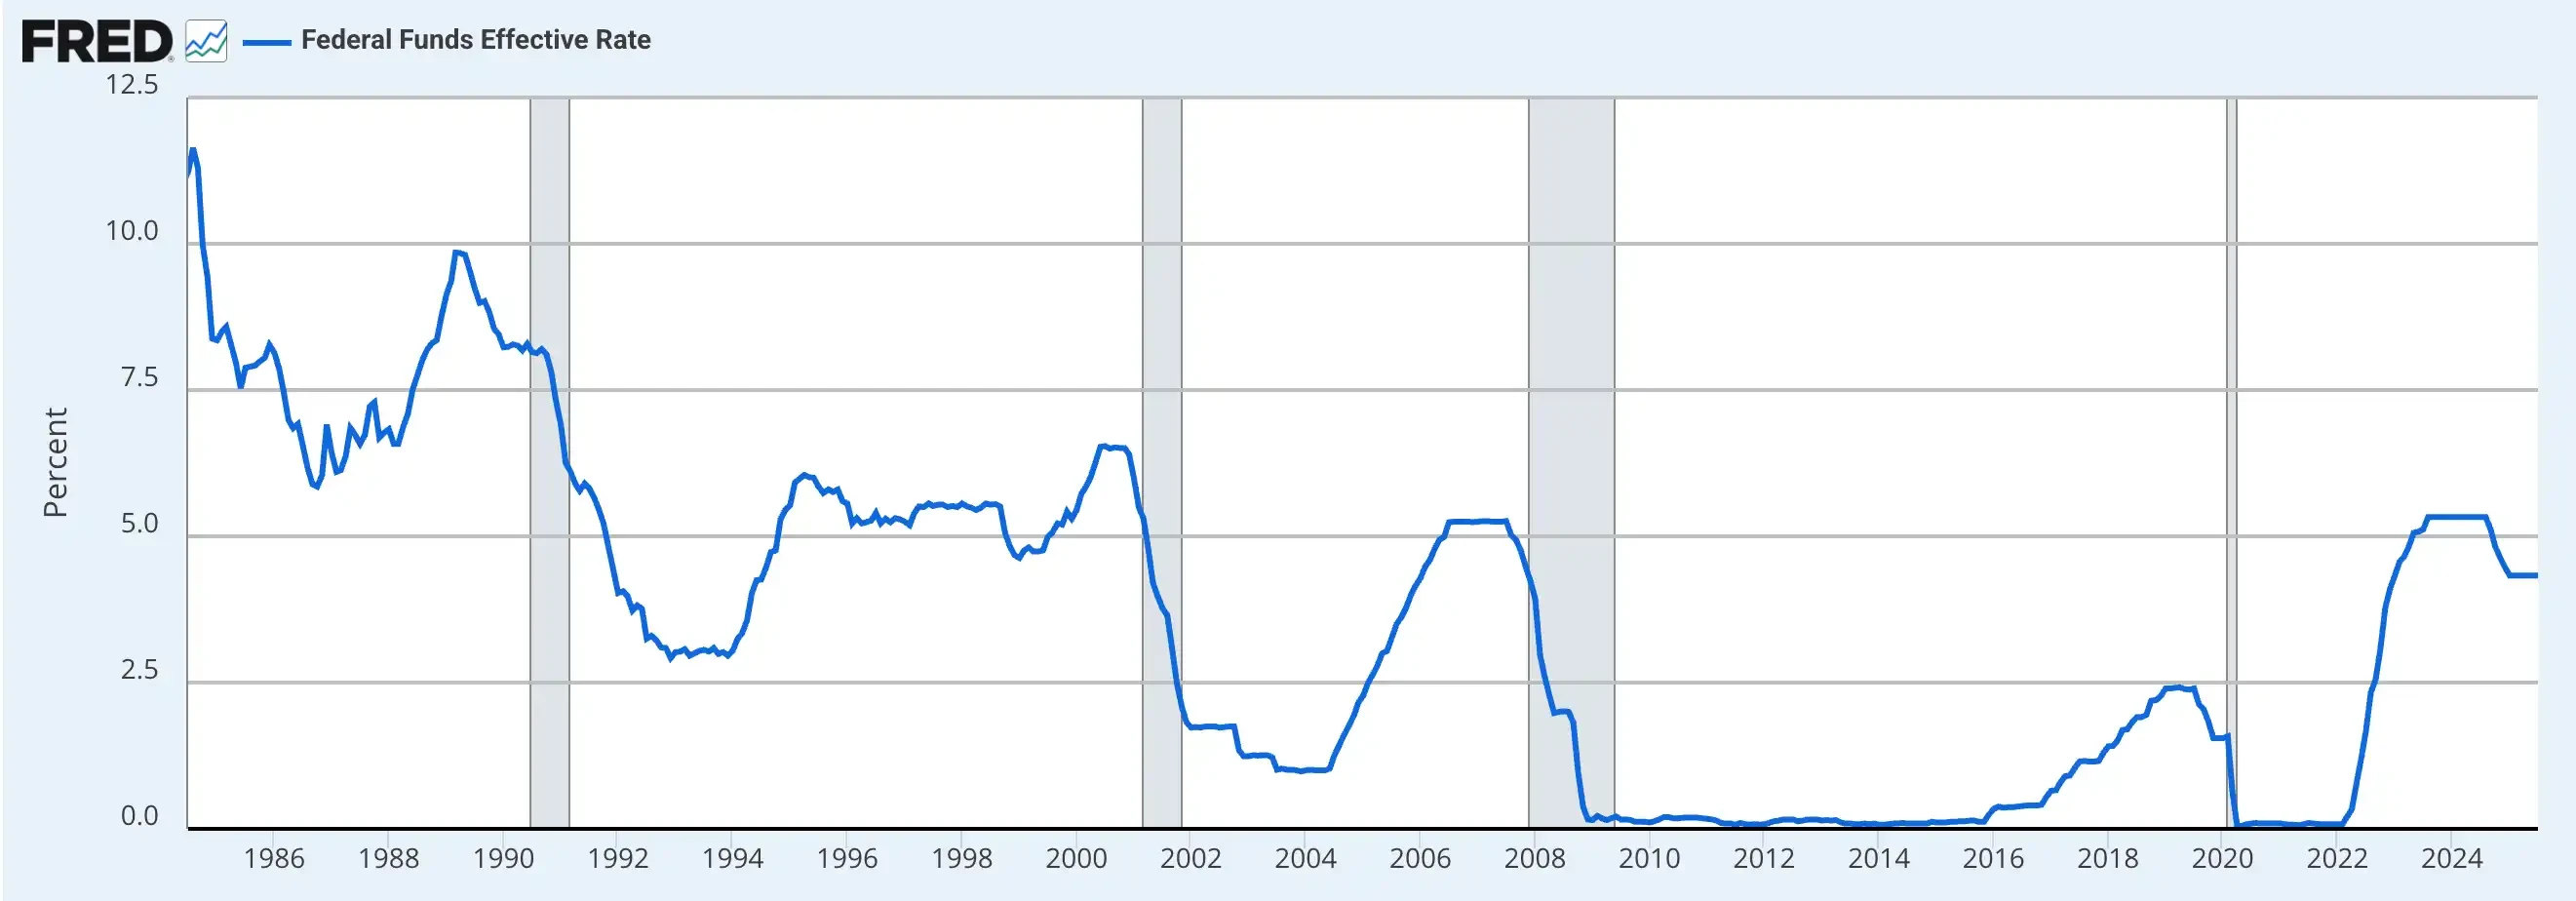
Since 1990, the Federal Reserve has experienced five major interest rate cut cycles, each driven by different economic contexts and policy motivations, resulting in distinct stock market reactions. Understanding the relationship between rate cuts and the market requires more than simply viewing them as “bull market buttons”; instead, a detailed analysis must be conducted in the context of the prevailing macroeconomic environment and investor sentiment.
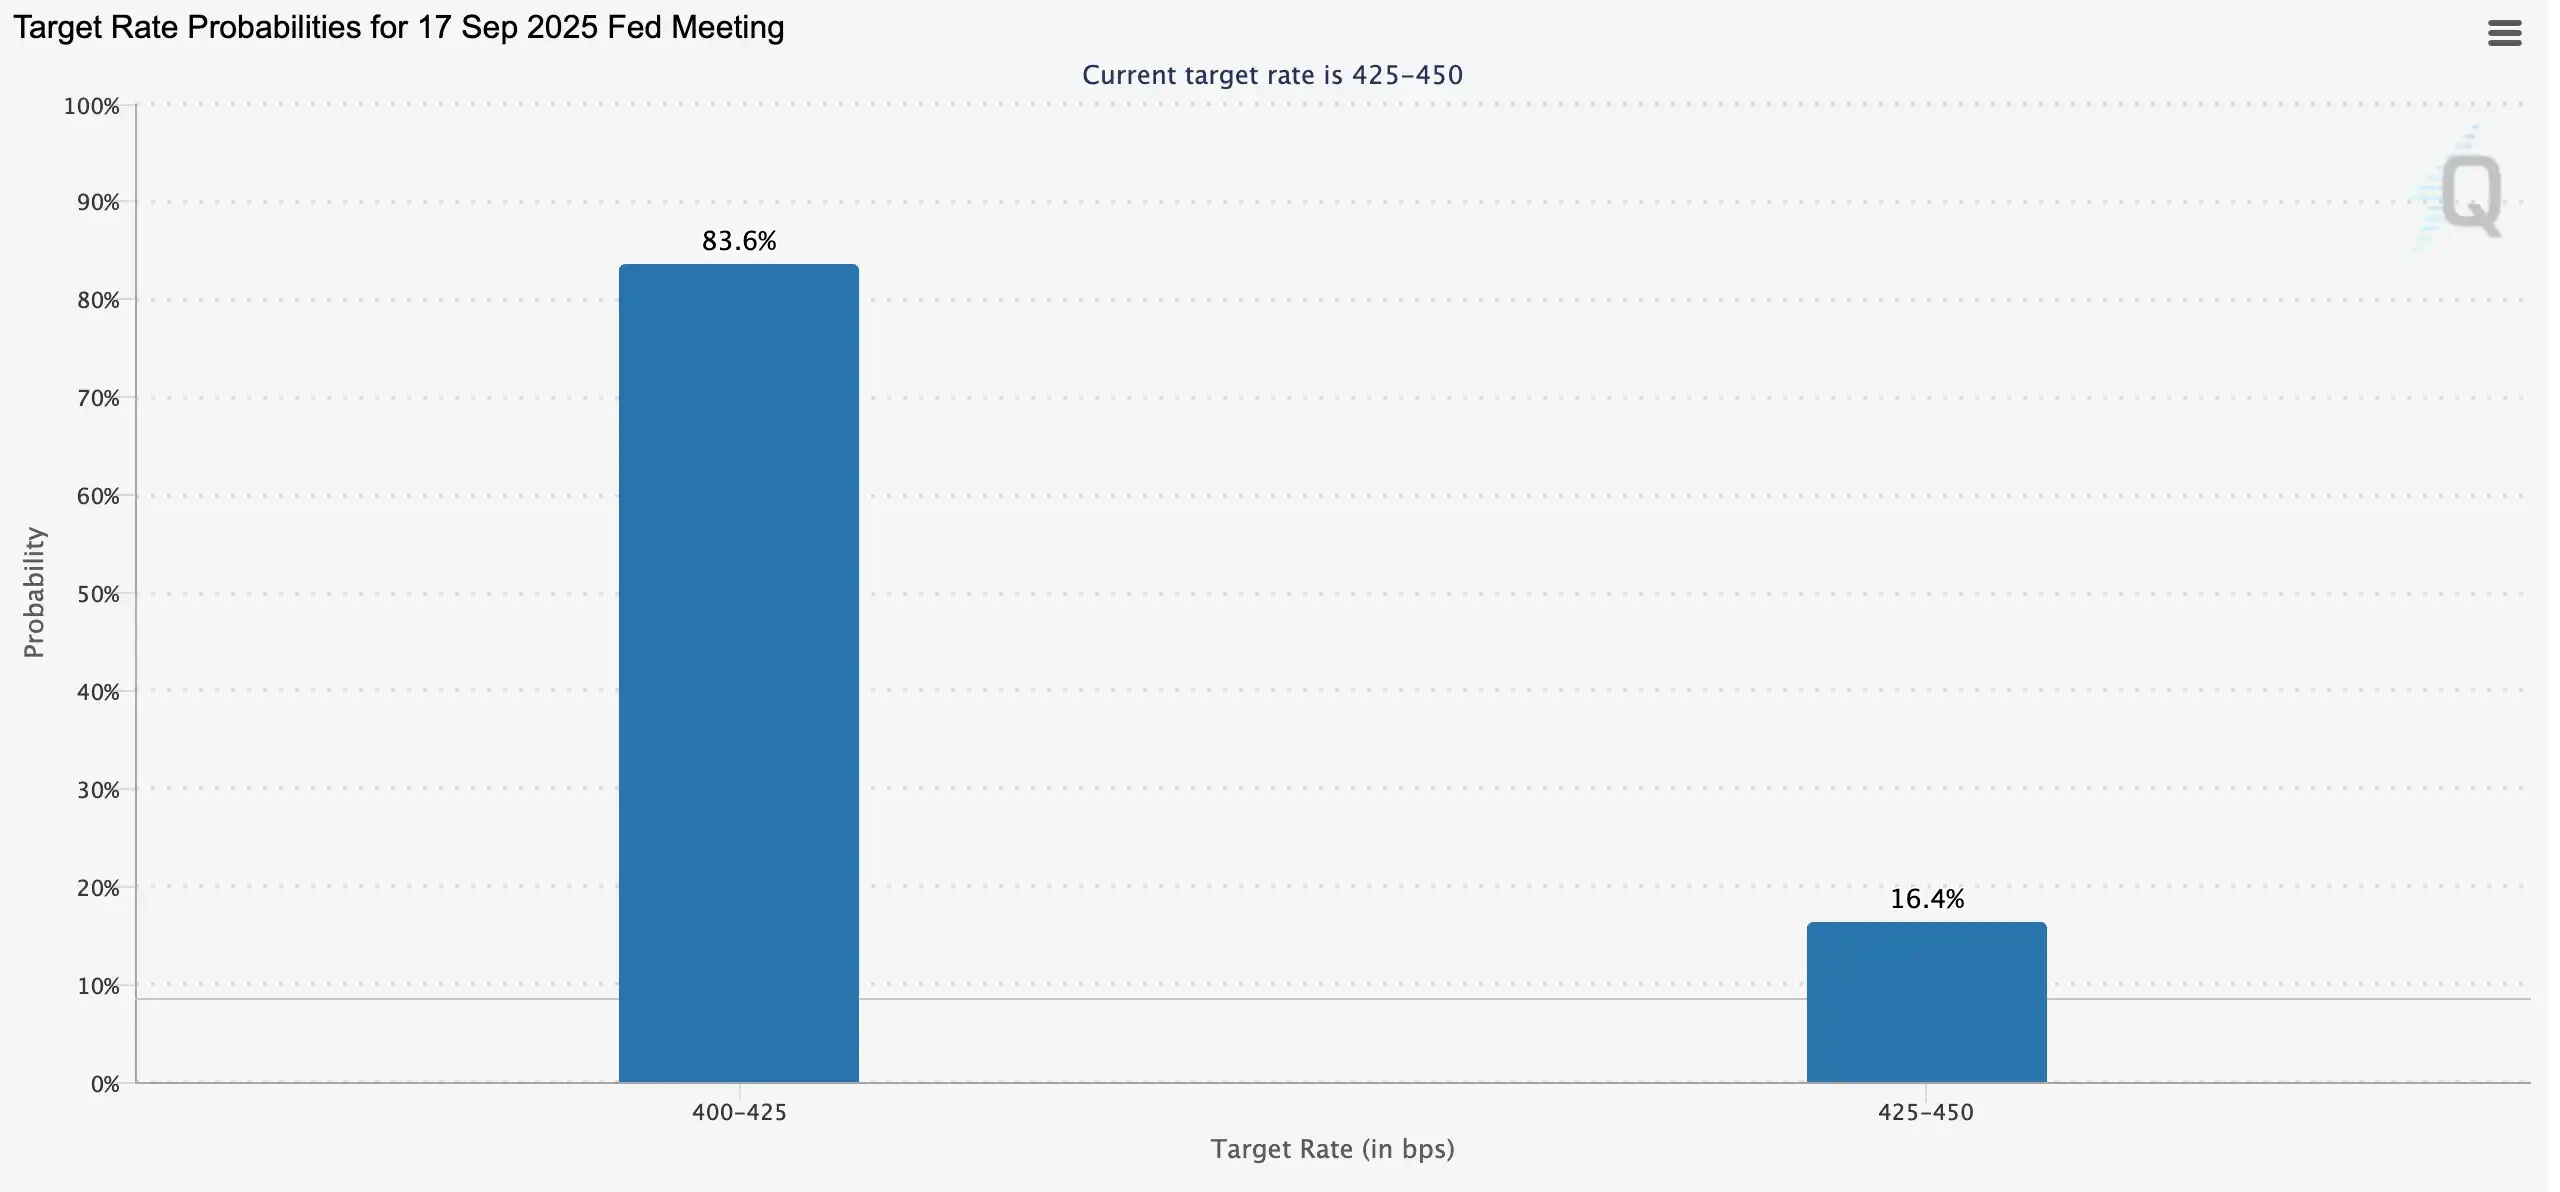
A full year has passed since the last interest rate cut, and the market is once again focused on the September meeting. According to FedWatch data, the probability of a 25 basis point rate cut by the Federal Reserve in September has reached 83.6%. Looking back over the past year, the S&P and Nasdaq Composite Index not only hit new all-time highs after the rate cut, but Bitcoin also saw a surge in value, rekindling the market’s belief that “rate cuts = a bull market.” Coinbase also believes that an easing monetary policy cycle will usher in an altcoin boom. However, is there a true correlation between rate cuts and market performance? This article will examine the economic and stock market performance during each of the Federal Reserve’s rate cut cycles since 1990, providing a more rational basis for judging the onset of a bull market.
Interest rate cuts and bull markets: Stock market performance during interest rate cut cycles
1990-1992: Soft landing after the Gulf War and the savings and loan crisis
From 1990 to 1992, the US economy was hit by the savings and loan crisis and the Gulf War. Credit tightened, consumption and investment slowed sharply, and the economy quickly fell into recession. The Federal Reserve began cutting interest rates from July 1990 until September 1992, bringing the federal funds rate down from 8% to 3%, launching a round of aggressive easing.
Initially, the Federal Reserve simply observed weakening economic momentum and financial market instability and opted for a gradual shift toward easing. However, Iraq’s invasion of Kuwait in August, resulting in soaring oil prices, a slumping economy, and widespread market panic, forced the Fed to accelerate its pace of rate cuts. By October, with the economy weakening further and the government reaching a budget agreement to reduce the deficit, the Fed intervened again. By the end of 1990, financial system pressures intensified, but inflation eased, opening the door for even more aggressive easing.
This interest rate cut effectively mitigated the negative impact of credit tightening and geopolitical crises. The US CPI rose from 121.1 points in 1989 to 141.9 points in 1993, but the year-on-year growth rate dropped from 4.48% to 2.75%, bringing inflation under control. GDP growth rebounded from -0.11% in 1991 to 3.52% in 1993, putting the economy back on track for growth.
The capital market’s reaction was even more direct. From 1990 to 1992, the easing effect of the Federal Reserve’s interest rate cuts significantly boosted investor confidence. The Dow Jones Industrial Average rose 17.5%, the S&P 500 rose 21.1%, and the tech-heavy Nasdaq soared 47.4%, becoming the strongest post-crisis recovery sector.

1995-1998: Preventing recession and the Asian financial crisis
After a successful “soft landing” during the tightening cycle of 1994–1995, the US economy still faced concerns about slowing growth. To avoid a recession caused by excessive tightening, the Federal Reserve decisively shifted to easing in 1995–1996, supporting the economy through interest rate cuts. This strategy proved highly successful, with US GDP growth accelerating from 2.68% in 1995 to 3.77% in 1996 and further jumping to 4.45% in 1997, putting the economy back on an upward trajectory.
However, the Asian financial crisis erupted in July 1997, sending capital markets into a state of turmoil. While fundamentals in the United States remained strong, global uncertainty escalated sharply, and the LTCM (Long-Term Capital Management) crisis ignited market panic. To prevent external shocks from dragging down the domestic economy, the Federal Reserve cut interest rates three times between September and November 1998, lowering the federal funds rate from 5.5% to 4.75%.
This round of modest rate cuts had a significant effect, maintaining economic expansion and ushering in a frenzy in the capital markets. Since the start of the easing policy, the Dow Jones Industrial Average has more than doubled, gaining 100.2%; the S&P 500 has soared 124.7%; and, driven by the tech boom, the Nasdaq has surged 134.6%, preemptively accumulating momentum for the subsequent dot-com bubble.

2001–2003: Post-dot-com recovery
From 2001 to 2003, the US economy was hit by the bursting of the dot-com bubble, the September 11th terrorist attacks, and the subsequent recession, plunging the market into a deep downturn. The dot-com bust triggered a stock market crash that quickly spread to the real economy, with a sharp drop in business investment, rising unemployment, and ultimately triggering an eight-month recession. The already fragile recovery was further derailed by the September 2001 terrorist attacks, which led to a sharp decline in financial markets and consumer confidence.
To address these pressures, the Federal Reserve launched one of the most aggressive easing policies in history over just two years. The federal funds rate was lowered from 6.5% at the beginning of 2001 to 1.75% in December of that year, and then further to 1% in June 2003, a cumulative reduction of 500 basis points. The Fed hoped to stimulate business reinvestment and consumer spending through extremely low financing costs, thereby stabilizing the economy.
While these policies did prevent a more severe systemic crisis, the recovery was not without its challenges. In 2002, US real GDP growth was only 1.7%, with weak business investment and a still-high unemployment rate, making economic recovery difficult. However, as the easing policy gradually took hold, growth momentum rebounded significantly in 2003–2004, with GDP growth reaching 3.85% in 2004, and the US economy regained stability.
However, the stock market’s reaction was far less than expected. Sharp interest rate cuts failed to reverse the decline in the capital market, and the three major stock indices still closed lower between 2001 and 2003: the Dow Jones Industrial Average fell 1.8%, the S&P 500 fell 13.4%, and the tech-heavy Nasdaq plummeted 12.6%. The experience of this period demonstrates that even significant monetary easing is unlikely to immediately counteract the profound impact of a structural bubble burst.

2007–2009: Financial crisis and the era of zero interest rates
The global financial crisis of 2007–2008 erupted, profoundly impacting the U.S. economy and financial system. The root cause of the crisis lay in the bursting of the real estate bubble and the concentrated outbreak of subprime mortgage problems. Previously, the U.S. real estate market had been booming, but as house prices fell, a large number of borrowers defaulted, and financial institutions suffered heavy losses from holding large amounts of subprime loans and related derivatives. This led to a freezing of the credit market and a sudden drying up of liquidity.
Faced with the rapidly intensifying crisis, the Federal Reserve embarked on a cycle of aggressive interest rate cuts beginning in September 2007, lowering the federal funds rate from 5.25% to a range of 0–0.25% by the end of 2008. This marked a total reduction of 450 basis points, nearly reaching the zero lower bound. The core objective of these cuts was to stabilize financial markets and the banking system through extremely loose liquidity provision, mitigating the impact of the credit crunch on the real economy. In March 2008, the Fed even brokered JPMorgan Chase’s acquisition of the near-bankrupt Bear Stearns to prevent a chain reaction of crisis contagion.
However, market panic persisted. The collapse of Lehman Brothers in September 2008 marked the full onset of the financial crisis. Subsequently, global markets were gripped by a liquidity panic, US unemployment soared to over 10%, corporate and household assets plummeted, and the economy plunged into its worst recession since the Great Depression. CPI figures showed unusual deflationary pressures, reflecting a precipitous drop in demand.
Macroeconomic data suggests that interest rate cuts failed to prevent the spread of the recession. US GDP growth fell to 1.9% in 2007, plummeted further to -0.1% in 2008, and shrank by -2.5% in 2009. It wasn’t until 2010, thanks to the combined effects of ultra-loose monetary policy and fiscal stimulus, that the US economy gradually stabilized, with GDP growth rebounding to 2.6%, laying the foundation for the decade-long expansionary cycle that followed.
The stock market’s performance was even more disastrous. Between 2007 and 2009, the Dow Jones Industrial Average plummeted 53.8%, the S&P 500 fell 56.8%, and the Nasdaq Composite dropped 55.6%. This “Great Recession” revealed that relying solely on interest rate cuts was insufficient to resolve the crisis.

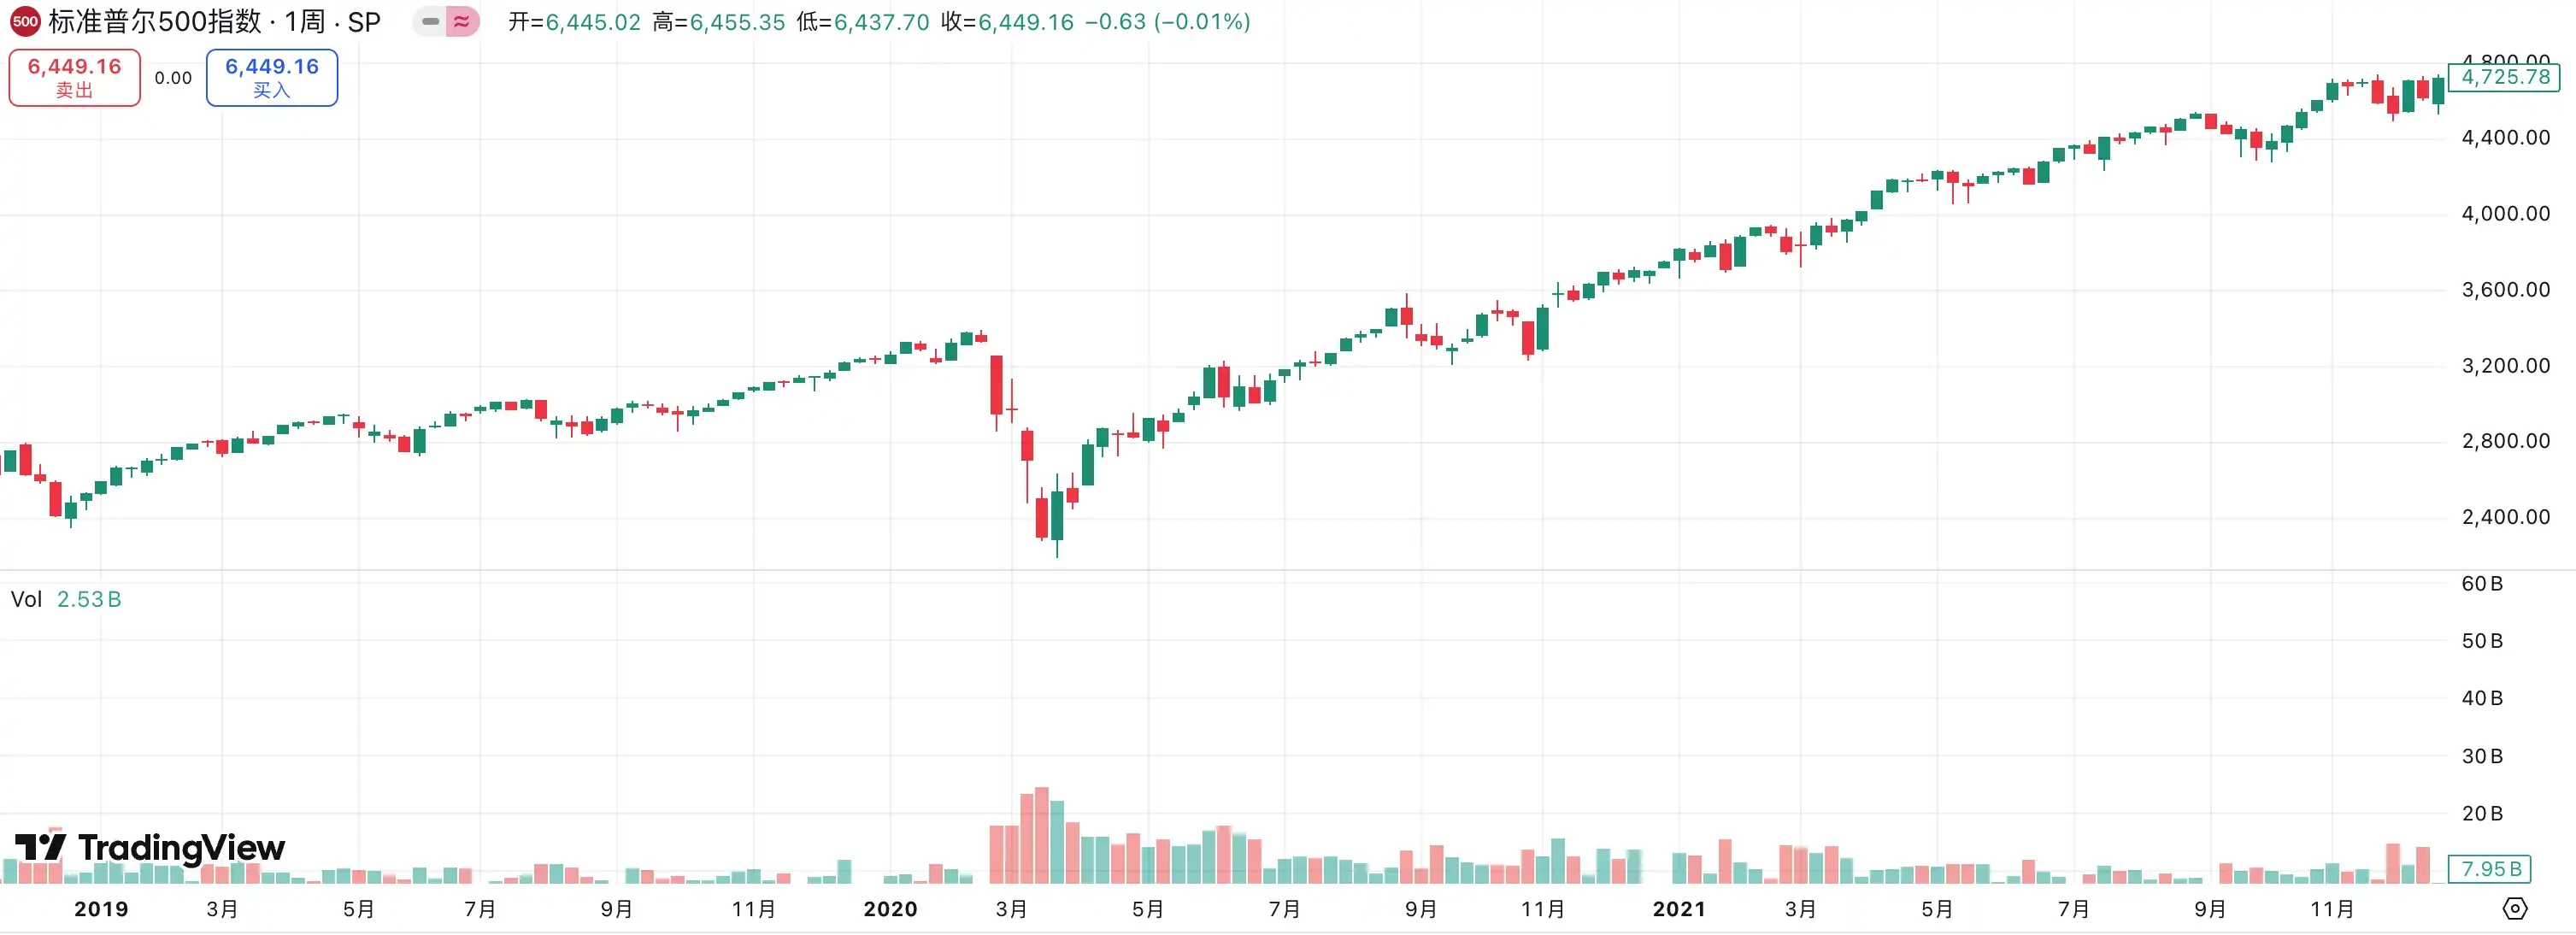
2019–2021: Precautionary easing and the impact of the epidemic
The Federal Reserve initiated a new round of interest rate cuts in August 2019, initially intended to address pressures from slowing global economic growth and uncertainties such as the Sino-US trade war. However, this seemingly mild, precautionary easing was escalated to extremes by the sudden outbreak of the COVID-19 pandemic in early 2020. The rapid spread of the pandemic triggered an unprecedented wave of economic lockdowns and shutdowns, disrupting global supply chains, plummeting consumption, soaring unemployment, and causing panic in financial markets.
To stabilize the situation, the Federal Reserve urgently lowered the federal funds rate from 2.25% to a near-zero 0.25% in March 2020. This, coupled with the government’s massive fiscal stimulus, included the introduction of unlimited quantitative easing, leading to a dramatic expansion of its balance sheet. This was not just a rate cut; it was also an exceptionally rare “unconventional” measure in the history of monetary policy, demonstrating the central bank’s resolve to stabilize the financial system and the fundamentals of the economy.
Macroeconomic data shows that the US economy remained relatively stable in 2019, with GDP growth of 2.3%. While lower than in previous years, it remained healthy. However, 2020, impacted by the pandemic, marked a turning point, with US GDP shrinking by a historic -3.4%, the worst contraction since the 2008 financial crisis. Thanks to a combination of ultra-loose monetary and fiscal policies, the US economy rebounded rapidly in 2021, with GDP growth reaching 5.7%, one of the fastest recoveries in four decades.
The stock market’s performance was equally breathtaking. After the March 2020 plunge, driven by loose policies and a flood of liquidity, the US stock market staged a V-shaped reversal and subsequently soared. Between 2019 and 2021, the S&P 500 rose 98.3%, the Nasdaq climbed a staggering 166.7%, and the Dow Jones Industrial Average saw a remarkable 53.6% gain. The extreme interest rate cuts and massive liquidity injections during the pandemic ultimately spawned the fastest-growing liquidity bull market in US stock market history.
How the two biggest bull runs in crypto history happened
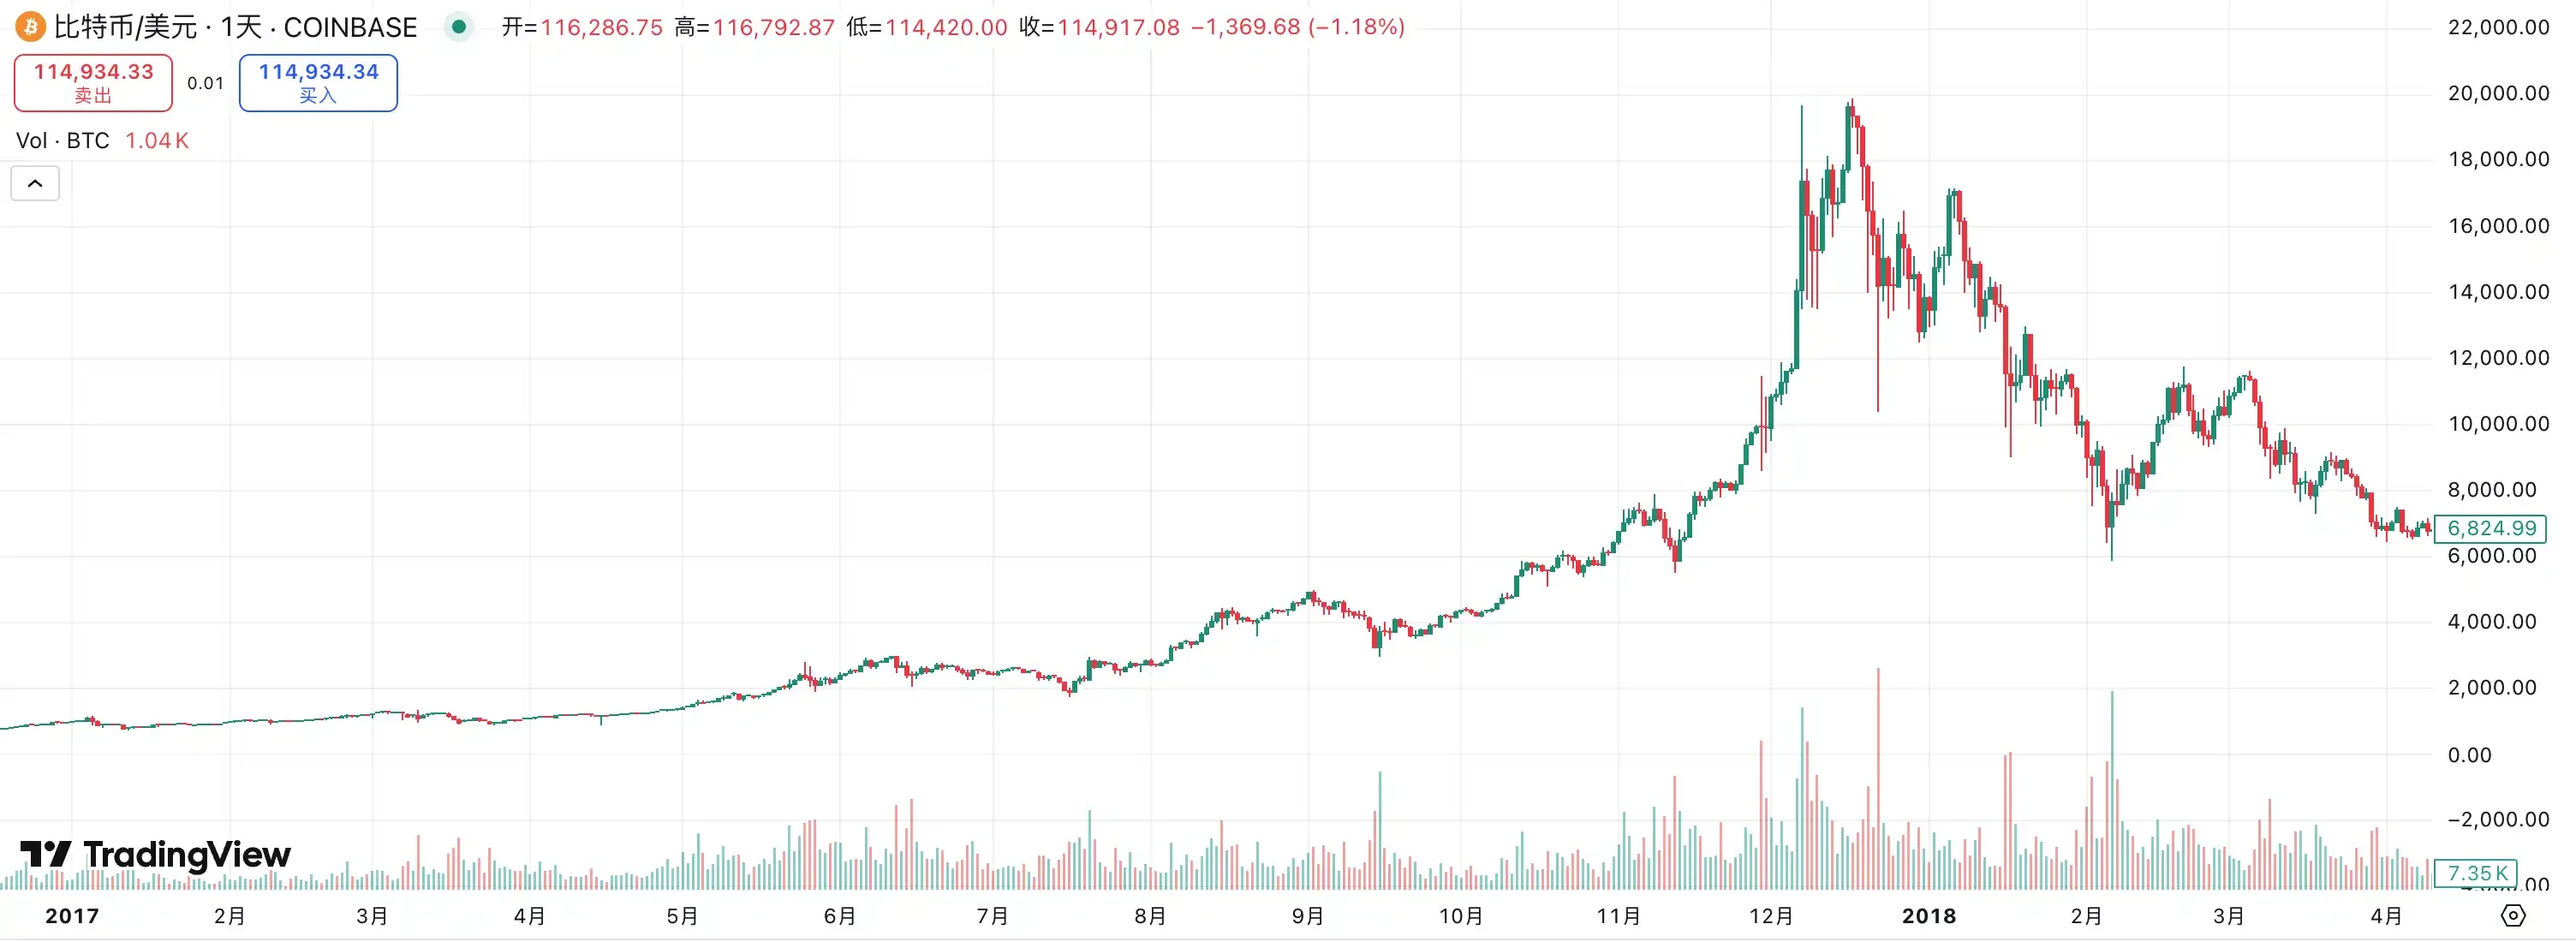
2017: ICO Mania and the First Crypto Bubble
2017 is widely considered the crypto market’s “first big boom,” marking the beginning of altcoins’ rise to prominence. Macroeconomically, the global economy was recovering, with the US economy performing robustly. While the Federal Reserve had begun tentatively raising interest rates, overall interest rates remained historically low, and liquidity left over from previous years of monetary easing lingered in the market. This macroeconomic environment provided a fertile breeding ground for speculative assets.
Bitcoin’s price soared from less than $1,000 at the beginning of the year, reaching nearly $20,000 by the end. This surge in the value of the leading asset attracted a flood of new capital and retail investors into the market. Against this backdrop, altcoins experienced an unprecedented boom. Unlike previous periods, the biggest driver of the altcoin market in 2017 was the ICO model: virtually any project could raise funds quickly by simply issuing a token on Ethereum. This led to the emergence of a large number of new coins, creating a phenomenon where hundreds of them soared simultaneously.
Ethereum was undoubtedly the core beneficiary of this rally. Since ICOs were generally based on Ethereum, it became a primary entry point for capital. Within a year, ETH’s price soared from a few dollars to $1,400, driving a surge in valuations across the entire altcoin sector. Meanwhile, from public blockchains, payments, storage, to various new concept tokens, almost all attracted short-term investment, regardless of whether their narratives were solid.
However, behind the frenzy often lies a bubble. The 2017 altcoin season was essentially a liquidity-driven speculative extravaganza, where investment logic relied more on “new stories” than practical applications. In early 2018, as Bitcoin peaked and then retreated, altcoin prices generally experienced deep retracements of 80%-90%. Numerous projects lacking fundamentals quickly collapsed, leaving behind a mess.
Looking back on this history, the 2017 altcoin season laid the foundation for the first global recognition of the crypto market: crypto assets can create a huge wealth effect driven by liquidity and narratives, but they also show extremely high risks when the bubble bursts.
2021: Liquidity Flood and DeFi, NFT Frenzy
If the 2017 altcoin season was a speculative feast triggered by ICO, then the 2021 altcoin market was a full-scale carnival against the backdrop of global liquidity overflow.
Regarding the macroeconomic environment, the COVID-19 pandemic broke out in early 2020, prompting the Federal Reserve to rapidly lower interest rates to near zero and initiate an unprecedented quantitative easing (QE). Simultaneously, the US government launched a massive fiscal stimulus program, directly distributing checks to residents. This dual stimulus of loose monetary policy and fiscal policy led to an overflow of liquidity in financial markets, simultaneously inflating both traditional and risky assets. Following the V-shaped rebound of US stocks in 2020, Bitcoin broke through the $20,000 mark by year-end and rapidly surged to $60,000 in the first quarter of 2021, opening up space for altcoins to surge.
Unlike the ICO-centric “single-point explosion” of 2017, the 2021 altcoin season saw a multi-sector boom. First, there was the rapid growth of DeFi. Protocols like Uniswap, Aave, and Compound saw rapid growth in TVL (value locked), driving DeFi-themed tokens to develop independently. Second, there was the emergence of NFTs. Projects like CryptoPunks and Bored Ape made “digital collectibles” a global hot topic, leading to explosive growth in trading volume on exchanges like OpenSea. Meanwhile, the flourishing Ethereum ecosystem fueled the rise of new public chains like Solana, Avalanche, and Polygon, officially initiating a competitive landscape within the public chain landscape.
Driven by this narrative, ETH soared from less than $1,000 at the beginning of the year to $4,800; SOL soared from less than $2 to $250, becoming one of the biggest dark horses of the year. The entire crypto market capitalization exceeded $3 trillion in November 2021, reaching a historical peak.
However, this rapid market expansion also sowed the seeds of a bubble. A large number of copycat projects, overly financialized DeFi products, and meme coins lacking fundamental support quickly gained popularity when hot money poured in, only to fall sharply when liquidity receded. With the Federal Reserve’s interest rate hike cycle beginning in 2022, global liquidity tightened, and the crypto market quickly cooled, with altcoins generally experiencing deep corrections of 70%-90%.
Looking back at this stage, the 2021 alt season demonstrated how extreme the crypto market can be, driven by a flood of liquidity and diverse narratives.

Current revelation: Preventive easing and copycat season
Historically, the Federal Reserve’s interest rate cuts can be divided into two categories: precautionary and bailout. The former occurred in 1990, 1995, and 2019. These cuts occurred before a full-blown recession and were primarily intended to hedge risk, often injecting new growth momentum into the market. In contrast, the 2001 and 2008 periods saw significant rate cuts forced upon the economy by the financial crisis, leading to sharp market declines. Currently, with a weak labor market, tariffs, and geopolitical uncertainties, while inflation has shown signs of easing, the overall environment resembles more of a precautionary approach than a crisis. This is precisely why risky assets have continued to strengthen this year, with both Bitcoin and US stocks reaching record highs.
The crypto market is also facing a different environment than before. For the first time, policy is experiencing unprecedented support: stablecoins are gradually being incorporated into regulatory frameworks, digital asset treasuries (DATs) and treasury management, exemplified by MicroStrategy, are becoming a trend in corporate investment, institutions are entering the market through ETFs, and the tokenization of real-world assets (RWAs) is gaining popularity. These diverse narratives are intertwined, driving a broader market foundation than ever before.
While many debate whether the September rate cut will trigger a short-term peak in the crypto market, such concerns may be overblown from a capital flow perspective. US money market funds have reached a record $7.2 trillion, with a significant amount of capital trapped in low-risk instruments. Historically, outflows from money market funds have correlated positively with gains in riskier assets. As rate cuts take effect, the attractiveness of these returns will gradually diminish, potentially unleashing more capital into crypto and other high-risk assets. This unprecedented cash pile is arguably the most potent potential tinderbox of this bull market.

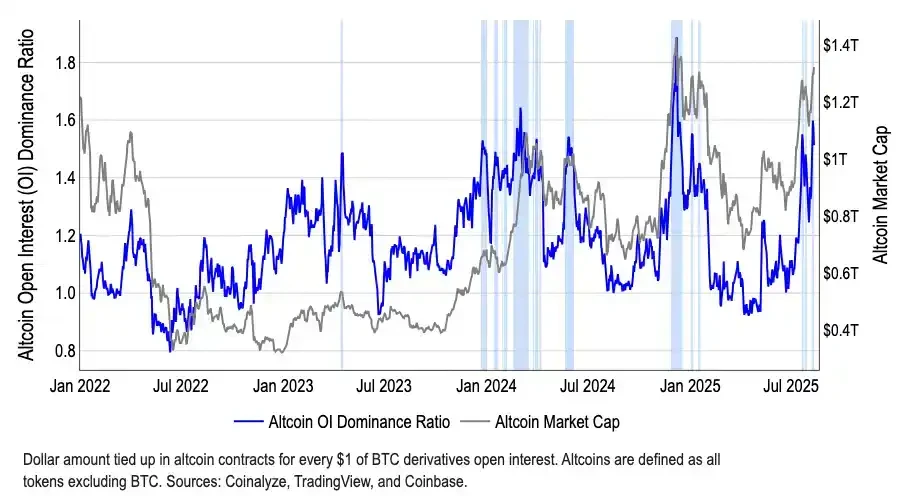
Furthermore, from a structural perspective, funds have begun to gradually shift away from Bitcoin. BTC’s market dominance has fallen from 65% in May to 59% in August. Meanwhile, the total altcoin market capitalization has grown by over 50% since early July, reaching $1.4 trillion. While CoinMarketCap’s “Altcoin Season Index” remains around 40, far from the 75 threshold that traditionally defines an altcoin season, this discrepancy between a low indicator and a surge in market capitalization reveals that funds are selectively flowing into specific sectors, particularly Ethereum (ETH). ETH not only benefits from institutional interest in ETFs exceeding $22 billion, but also carries the core narrative of stablecoins and RWAs, making it a more attractive asset than Bitcoin.
Related reading: Coinbase Report: $7 Trillion in Cash Ready to Go, Altcoin Season May Arrive in September
Summarize
The logic behind this bull market is radically different from previous ones. Due to the sheer number of projects, it’s impossible to replicate the “millions of coins soaring” phenomenon. Investors are increasingly focusing on value investing and structural opportunities. Funds are increasingly drawn to leading projects with real cash flow, regulatory compliance, or compelling narratives, while long-tail assets lacking fundamental support are destined for marginalization.
At the same time, overall market valuations are already high, and the risk of treasury strategies becoming over-financialized remains uncertain. A concentrated sell-off by institutions or project owners could easily trigger a stampede, profoundly impacting the market. Coupled with global macro uncertainties (such as tariffs and geopolitical factors), investors cannot ignore potential volatility.
Therefore, while we are optimistic about the performance of crypto assets amidst the interest rate cut cycle and favorable policies, we must acknowledge that this is more of a structural bull market than an indiscriminate general rise. Rational investment and careful selection of sectors are the keys to navigating volatility.
This article is sourced from the internet: The revelation of the interest rate cut cycle: looking at the structural opportunities in the crypto market from historical fluctuationsRecommended Articles
Related: Portrait of crypto gamblers: bait of luck, prisoner of K-line
Original author: ChandlerZ, Foresight News “You think you’re trading, but you’re just pulling the lever on a slot machine.” The crypto market, especially contract trading, operates 24 hours a day, with leverage as high as 100 times, and there is no warning of liquidation. There is no need to wear suits, place bets, or sign orders. Even emotions can be expressed in the form of emoticons. It can be said to be one of the most hidden yet most efficient addiction machines in the crypto world. Cultural anthropologist Natasha Dow Schur wrote the book Bait of Luck through long-term field research on slot machine players in Las Vegas. The book presents a panoramic view of the gambling industry, individual gamblers and the basic concepts of modern society, and also reveals…


Ok