Golden cross trap after $110,000? Bitcoin market outlook and position suggestions
Original author: 𝗰𝘆𝗰𝗹𝗼𝗽
Original translation: Tim, PANews
Everyone thought $140,000 was the next target, but things didn’t work out that way.
After studying all the historical scenarios and market data, why do I think Bitcoin is about to drop slightly?
Is the golden cross a blessing or a curse?
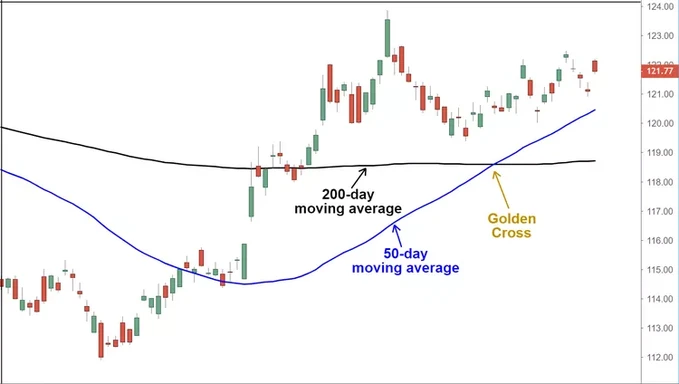
A golden cross is a technical indicator pattern that occurs when the 50-day moving average crosses above the 200-day moving average, and in all technical analysis this is generally considered a buy signal or a bullish indicator.
But what if I tell you that the situation is not that simple and that the golden cross may lead to a crash?
Let me explain it to you.
Yes, fundamentally, the presence of a golden cross indicates that short-term momentum is overtaking long-term momentum (usually a bullish development).
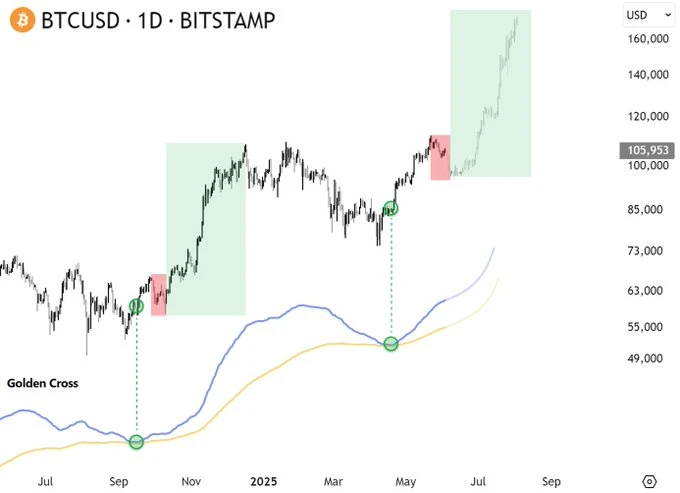
But historical data shows that every time a golden cross is formed, Bitcoin always plummets by 10%. After this plunge, Bitcoin will rebound strongly and set a new historical high again.
Let’s dig into specific cases:
-
In February 2021, when Bitcoin’s 50-day moving average crossed the 200-day moving average, it plunged 10% in 7 days.
-
In March 2024, Bitcoin plunged 11% and then violently pulled back to a new high
Facts have proved that the appearance of the golden cross is nothing more than the ultimate means of washing the market before the main force pulls up, used to get rid of floating chips (paper hands and retail investors), thereby promoting a real price breakthrough.
Everything suddenly became clear, and it was this breakthrough that triggered a wave of large-scale funds chasing the rise.
Those who left the market re-entered the market due to FOMO, which in turn fueled an even more violent rise.
This is how the golden cross pattern works.
This week, Bitcoin has seen a correction of about 8%, in line with past practice. It has now rebounded, indicating strong buying around $104,000 to $105,000.
On the other hand, it is clear that the upside momentum above $110,000 has been exhausted.
(This can lead to a phenomenon called “news overconsumption” where good news elicits no reaction at all)

What will be the subsequent trend?
If we can hold $105,000 (which we have a high probability of doing), it will go straight to the $150,000 mark and repeat the golden cross pattern.
If it falls below the $100,000 mark, a small correction to the $90,000 to $95,000 range is expected.

If you dont have a position yet, now is a good time to enter. I am strongly bullish in the short term.
But at the same time, I am in a more risk-averse state: I only hold strong blue-chip coins such as Bitcoin, Ethereum, Solana, and select a few potential altcoins with investment value, such as Cookie, W, and IOTA.
If you already have a position and you are not sure whether to sell or add to it, stick to your strategy.
This article is sourced from the internet: Golden cross trap after $110,000? Bitcoin market outlook and position suggestions
Related: Bitcoin hits all-time high, have long-term holders started to sell?
Original author: Matt Crosby Compiled and edited by: BitpushNews After a period of volatility, Bitcoin has now reclaimed the $100,000 mark and hit a new all-time high, injecting new confidence into the market. But as prices rise, a key question also arises: Are Bitcoins most experienced and successful holders – the long-term holders – starting to sell? This article will analyze what on-chain data reveals about the behavior of long-term holders and whether recent profit-taking is a cause for concern or simply a healthy part of Bitcoin鈥檚 market cycles. Signs of profit taking The Spent Output Profit Rate (SOPR) provides instant insight into realized profits across the network. Focusing on recent weeks, we can clearly observe an upward trend in profit realization. The clustering of green bars suggests that a…